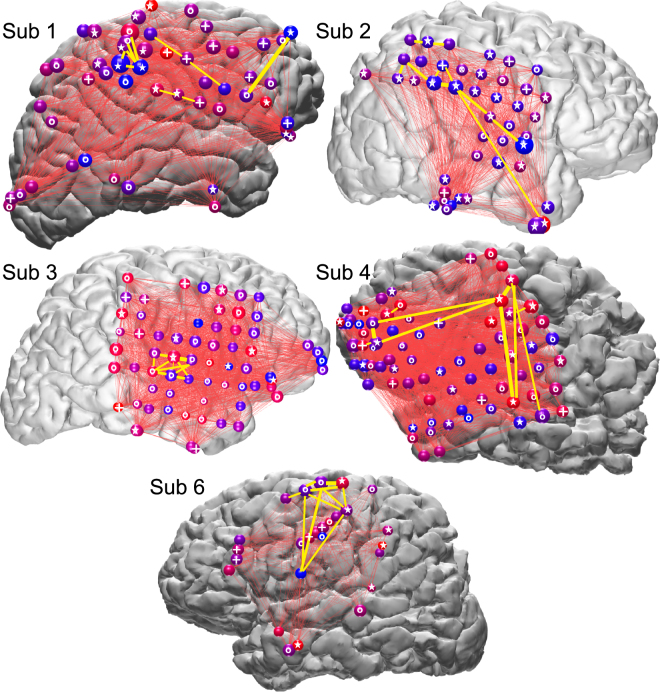
Figure 7.
Participation of widespread cortical areas in Motifs. Spheres represent ECoG electrodes, with circles (o), plusses (+), or stars (☆) on the spheres indicating that they showed a significant deviation from chance (FDR corrected p < 0.05) in their occurrence rate, in their temporal order in the motifs, or in both, respectively. Specifically, a circle indicates that the amount of high gamma peaks seen at this cortical location was significantly different (more or less) from expected value based on chance alone. Similarly, a plus indicates that the likelihood for this cortical location to have high gamma peaks in the first quarter of an Event was significantly different (higher or lower) from chance, i.e. 25%. The size of each sphere indicates HG peak occurrence rate; color indicates the likelihood of HG peaks being early versus late in an Event (red: early, blue: late). Thin red lines connect the electrode pairs that produced temporally adjacent HG peaks within Events. Yellow lines connect the ten electrode pairs that produced the largest numbers of temporally adjacent HG peaks. Plotted are HG peaks from Motifs occurring in all waking and sleep periods (i.e. from both waking and NREM (the two Sleep-Post periods) Events that matched to waking Motifs with higher occurrence in Sleep-Post than in Sleep-Pre).

