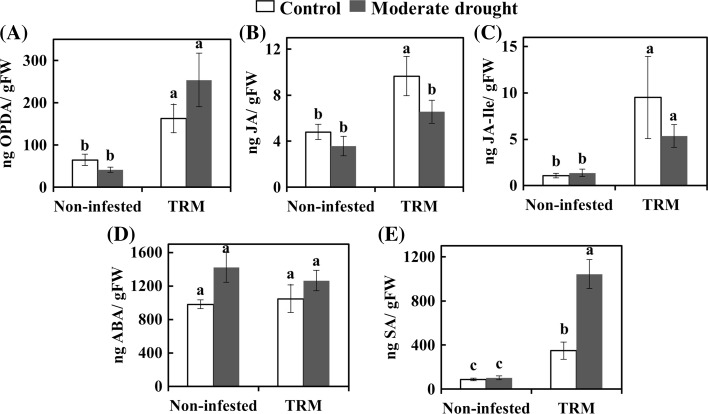
Fig. 3.
Phytohormone levels in tomato leaves from control plants and plants under moderate drought stress and/or infested with Aculops lycopersici (TRM) at 7 days post infestation. The bars represent the mean ng of phytohormone per g of fresh weight (FW) ± SE of endogenous OPDA (A), JA (B), JA-Ile (C), ABA (D), SA (E). Different letters in each figure indicate significant difference between treatments (two-way ANOVA, Newman–Keuls post hoc test, p < 0.05)

