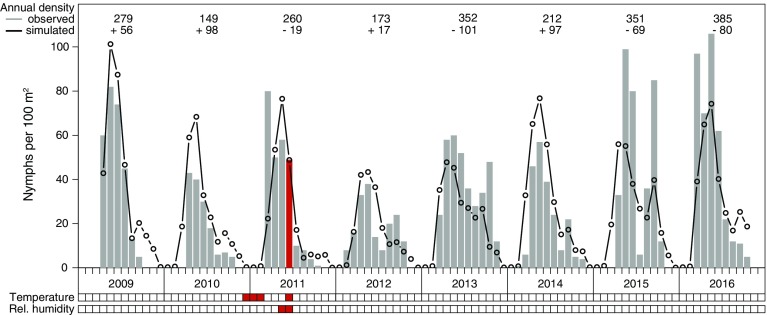
Fig. 3.
Monthly nymphal tick density in Haselmühl (Germany) between 2009 and 2016 (unit: nymphs per 100 m). Observations are shown as grey bars and simulations as lines. To illustrate the climatic variables determining the density in May 2011, the mean temperature between November 2010 and January 2011 as well as the mean relative humidity from April to May 2011 are highlighted in red

