Fig. 7.
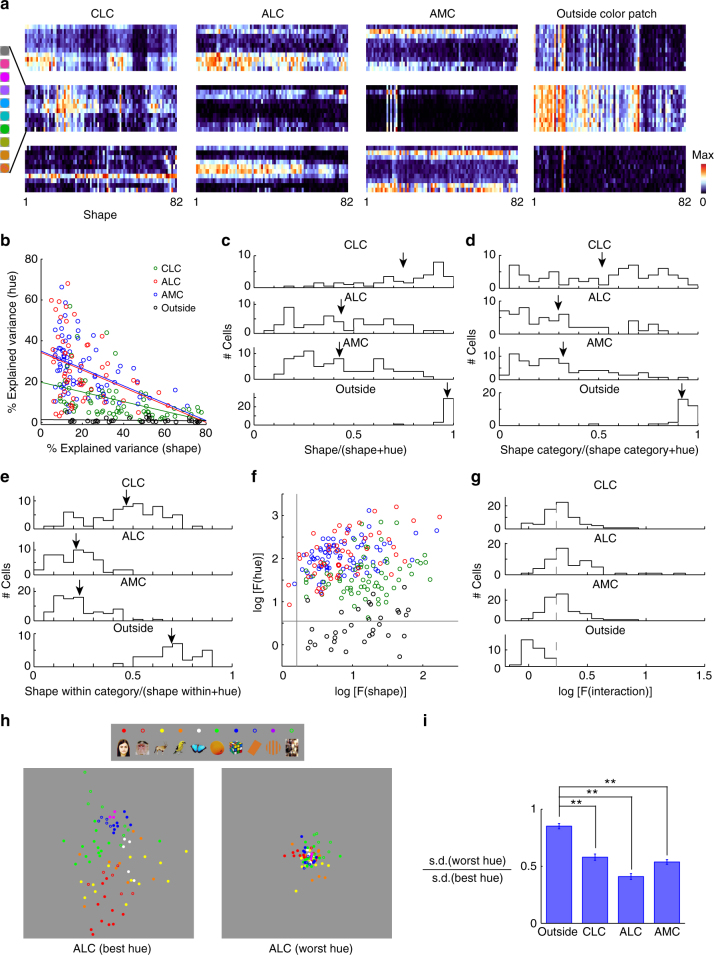
Analysis of single-cell responses. a Responses of 12 example neurons to the full stimulus set. Each row represents one color condition, and each column represents one object shape. b-g Two-way ANOVA analysis examining main effects of shape and hue, as well as interactions. Two-way ANOVA analysis with 8 levels of hue and 82 levels of shape was performed on responses of each individual neuron. b Relationship between explained variances by two main effects for all neurons. Lines represent linear fits to cells in each patch. c Distribution of shape preference in all three patches and outside the color patches, defined by the explained variance by shape divided by the sum of both main effects. Arrows indicate population averages. d similar to (c), but using only coarse shape categories as shape variables. e similar to (c), but using only fine shapes within each shape category as shape variables. ANOVA analysis was carried out for each shape category independently, with 8 levels of hue and n levels of shape (n = number of shapes within this shape category). For each neuron, shape preference was computed and averaged across categories. f For 2-way ANOVA with 8 levels of hue and 82 levels of shape, F-values for both main effects are plotted against each other in log-scale. Gray lines indicate significance level (p = 0.001). g Distribution of F-values for the interaction between hue and shape. Gray dashed-lines indicate significance level (p = 0.001). h For each cell in ALC, we determined the best hue and the worst hue based on responses to 8 hues averaged across 82 object shapes. MDS analyses were conducted on shape responses for the best hue or the worst hue of each cell. Two MDS plots are shown at the same scale. i For each cell, the ratio between standard deviations of shape responses at the worst hue and the best hue was computed. If the cells were linearly adding hue and shape, the two standard deviations should be identical. Therefore, the ratio between these two reflects the extent of nonlinearity in the interaction of hue and shape. **p < 0.01, Student’s t-test

