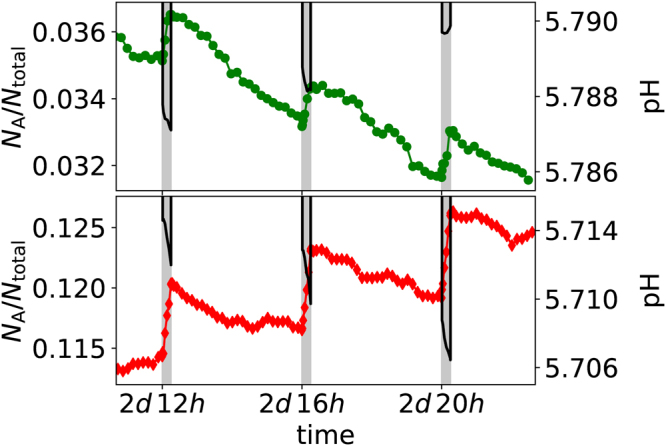
Figure 1.

Examples of the coupled changes in biofilm composition and pH over a 12 hour period, with one 15 minute glucose pulse every 4 hours as highlighted by the vertical grey bars. The composition is expressed by the ratio of , the number of aciduric (A) particles, to the total number of either type . Note that the small variations in pH translate to much larger changes over periods of days. The top figure corresponds to a total sugar intake of 10 g/L/d, and the bottom figure to a system with twice that amount (20 g/L/d). In both figures, the symbols denote the fraction of particles that are of type A, with the values given on the left hand axes. Conversely the solid black lines show the pH measured at the enamel surface during each pulse, with values given on the right hand axes. Only the pH during a pulse is shown; the lowest pH between pulses is approximately 6.0 in both cases and is not plotted for clarity.
