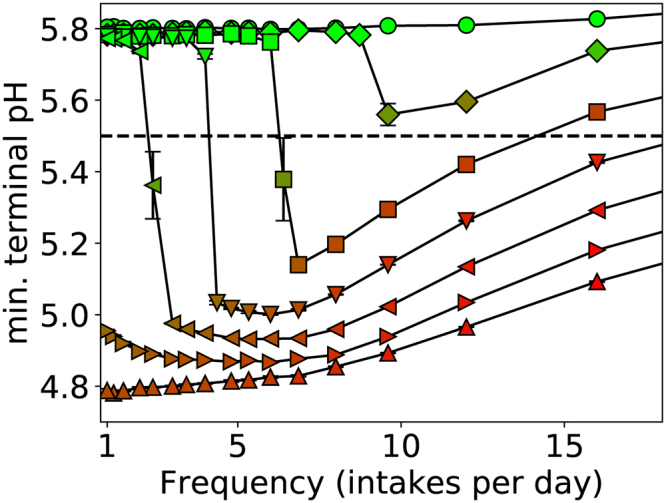
Figure 3.

Minimum pH versus frequency of intake taken at a time of 60 days, where each line corresponds to a different total amount of glucose as indicated in the legend. From top to bottom, the curves correspond to total amounts of 10 g/L/d (○), 12.5 g/L/d (◊), 15 g/L/d (□), 17.5 g/L/d (▽), 20 g/L/d (◁), 22.5 g/L/d (▷), and 25 g/L/d (△). Markers are coloured according to with N A the number of aciduric (A) particles and N total the total number of particles of either type, with red for high values and green for low values, and the line pH = 5.5 below which enamel dissolution is expected to occur has been highlighted. Sample size n = 5 per point and standard errors shown.
