
Figure 5.
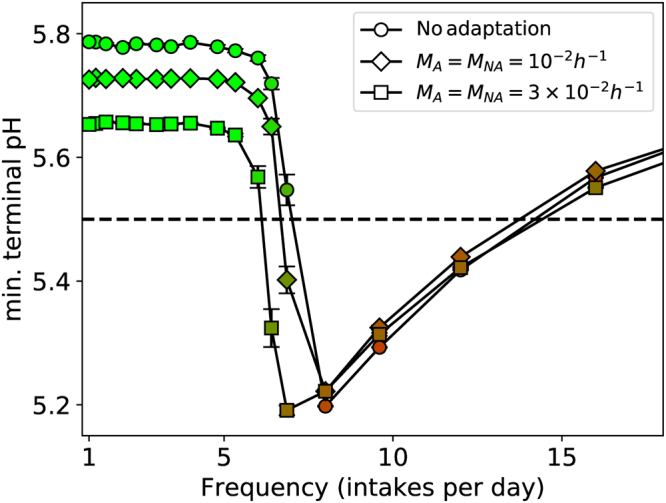
Minimum pH versus frequency of sugar intake for two rates of adaptation, with the data for no adaptation also shown for comparison. The total amount of sugar is the same for all cases (15 g/L/d), and the data were taken after 60 days of growth. Markers are coloured to , with red for high values (A dominance) and green for low values (NA dominance). Sample size n = 5 per point and standard errors are shown. A = aciduric; NA = non-aciduric.