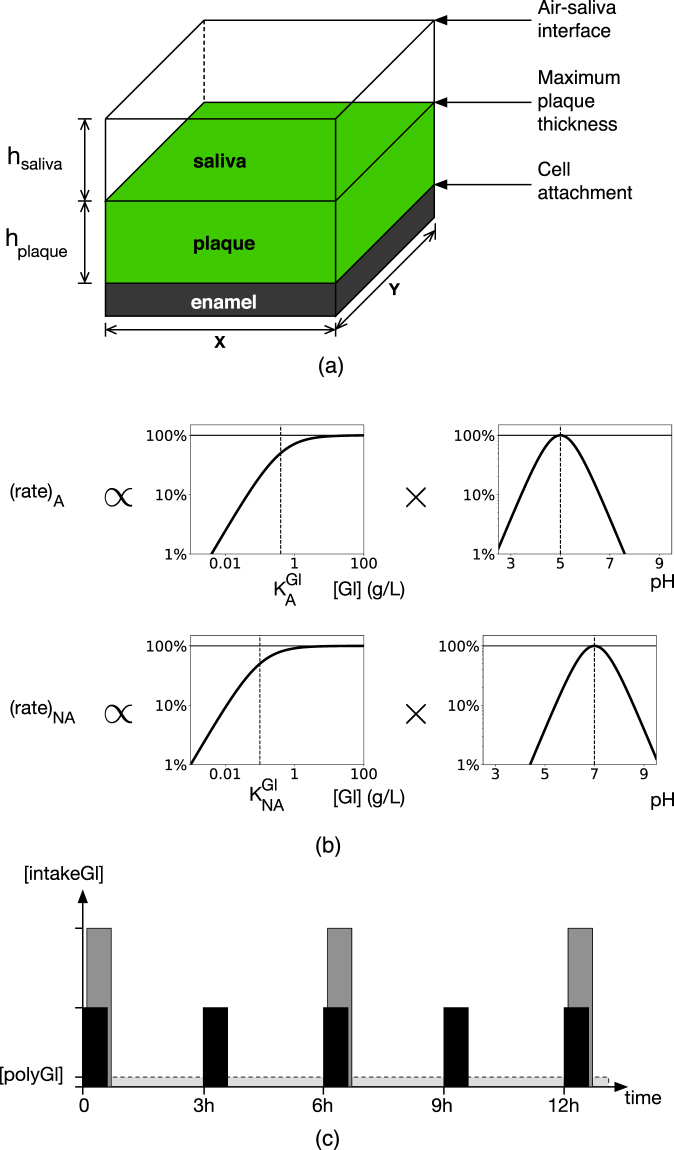
Figure 7.
Schematic representation of key model components. (a) The model domain included a plaque biofilm region adjacent to the enamel surface, and a more distant saliva region. Periodicity was assumed along the x and y-axes. (b) Graphical representation of the glycolytic rates for cell types A and NA, with a saturation factor for glucose availability ([Gl] of either [intakeGl] or [polyGl]), and an optimum pH of 5 and 7 for A and NA, respectively. Cellular growth was proportional to the glycolytic rates. (c) Schematic representation of periodic sugar intake showing two different frequencies, one pulse every 3 hours (black) and once every 6 hours (grey), with the same total amount. The constant, low concentration of [polyGl] is also shown. A = aciduric; NA = non-aciduric.

