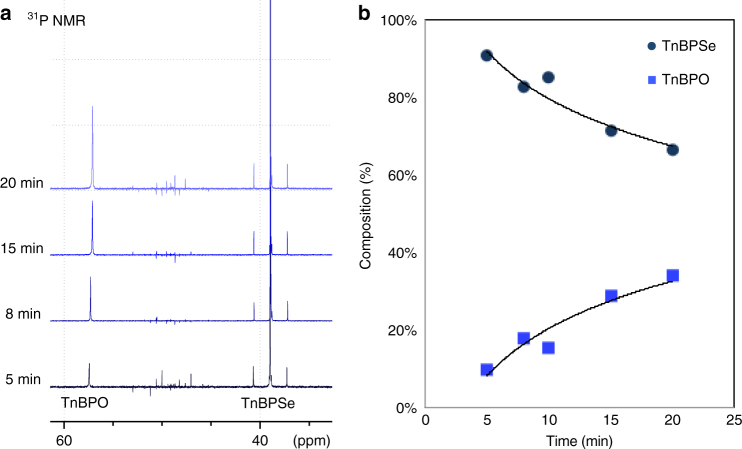
Fig. 1.
A NMR analysis following decomposition of TnBPSe after hot injection. a The 31P NMR spectrum of the reaction mixture over time, showing that the relative amount of TnBPSe decreases as the amount of TnBPO increases. b The percent composition of TnBPSe (navy blue circles) and TnBPO (royal blue squares) in the TnBPSe decomposition reaction over time. 31P and 77Se NMR of TnBPSe before reaction can be found in Supplementary Fig. 1. Trend lines are provided as guides to the eye

