Fig. 5.

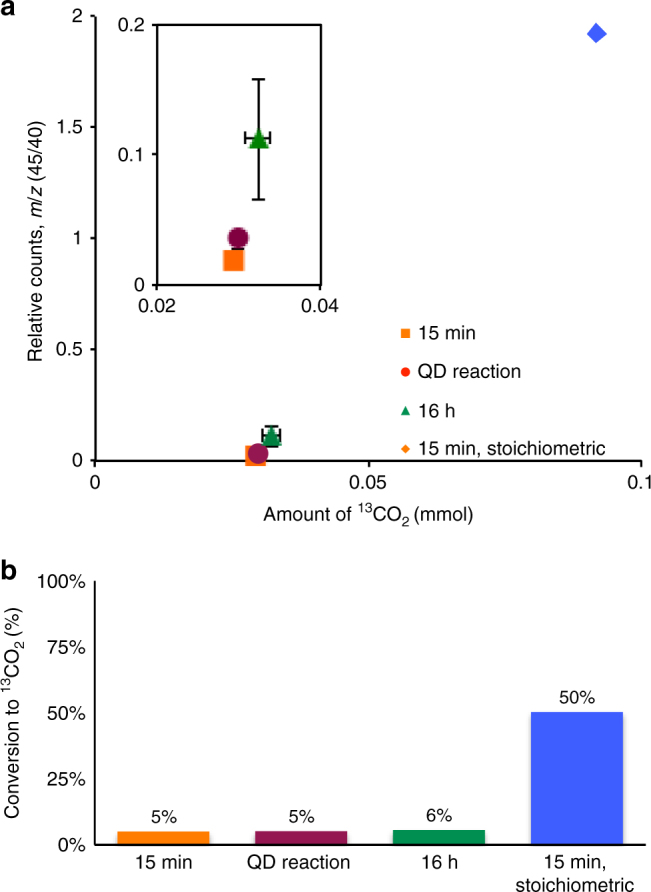
Detecting 13CO2 from cadmium octanoate decomposition. a Headspace samples from different reaction conditions and the amount of 13CO2 detected, the calibration curve to which these values are fit in Supplementary Fig. 20. b Bar graph of calculated percent conversion of cadmium carboxylate to 13CO2 during the decomposition reaction. Samples compared include the headspace from; a Se-free decomposition with 12 times excess carboxylic acid after 15 min, a QD reaction, a Se-free decomposition with stoichiometric amounts of carboxylic acid after 15 min (QD absorbance spectrum in Supplemental Fig. 21, and a Se-free decomposition with excess carboxylic acid after 16 h. Tabular data can be found in Supplemental Table 2. Error bars depict the standard error of the mean of five replicate experiments
