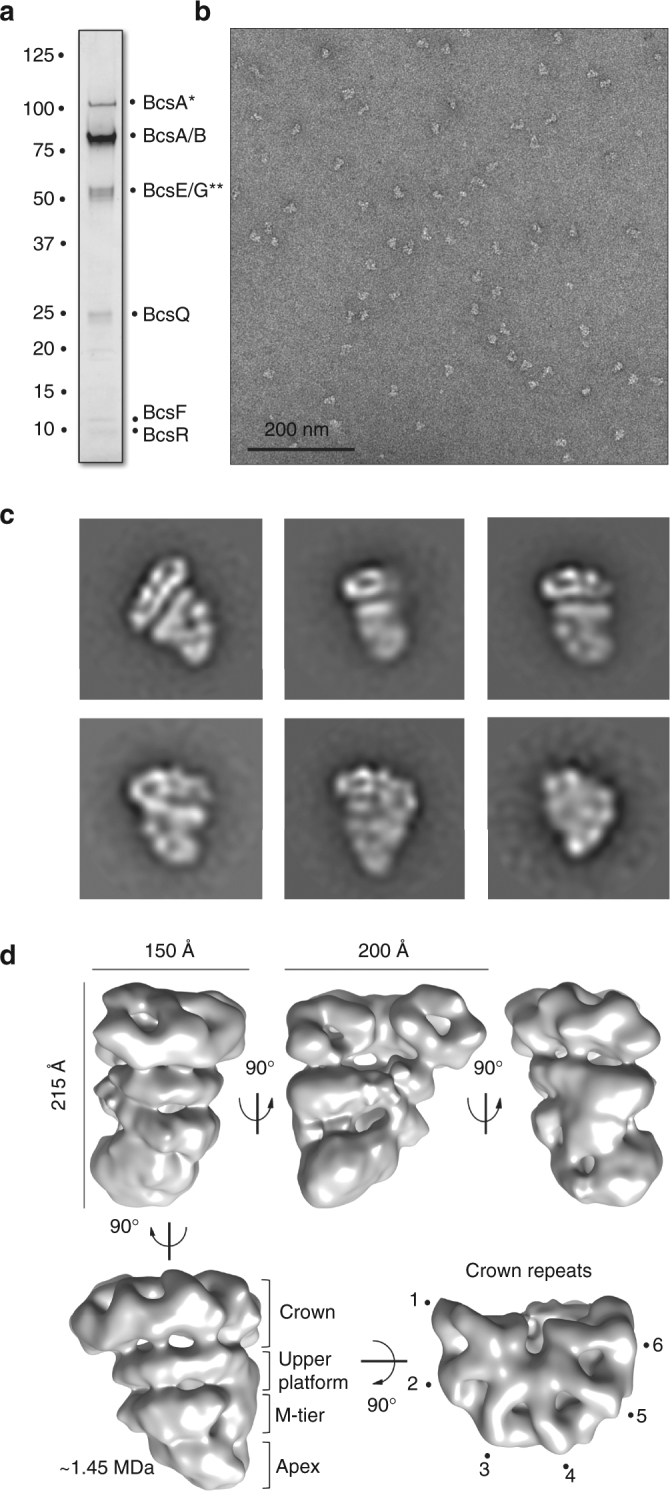
Fig. 2.

Electron microscopy analysis of the Bcs macrocomplex. a Purification of the Bcs macrocomplex expressed in the overexpression E. coli 1094 bcsA HA-FLAG 2K7 strain. SDS-PAGE of the affinity-gradient and density gradient-purified Bcs macrocomplex stained with Coomassie blue. Band labels are as identified by mass-spectrometry and immunoblotting. Asterisks denote presence of consistently identified contaminants discussed in Supplementary Fig. 2. b A representative micrograph of the negatively stained Bcs macrocomplex from the dataset used for image processing. c Representative views (class averages of 2D projections; not to scale) of the negatively stained Bcs macrocomplex. d Structure of the Bcs macrocomplex at 16.7 Å resolution. Different views and the relative rotational angles are shown. The characteristic layers and crown repeats are indicated in the bottom. The overall dimensions of the complex are indicated by size bars (top left and middle). The approximate molecular weight of the complex calculated from volumetric analyses of the reconstruction is indicated in megadaltons (MDa). Owing to the nature of the negatively stained sample, this estimation accounts only for the low-resolution envelope reconstruction and not intrinsic to the proteins electron density
