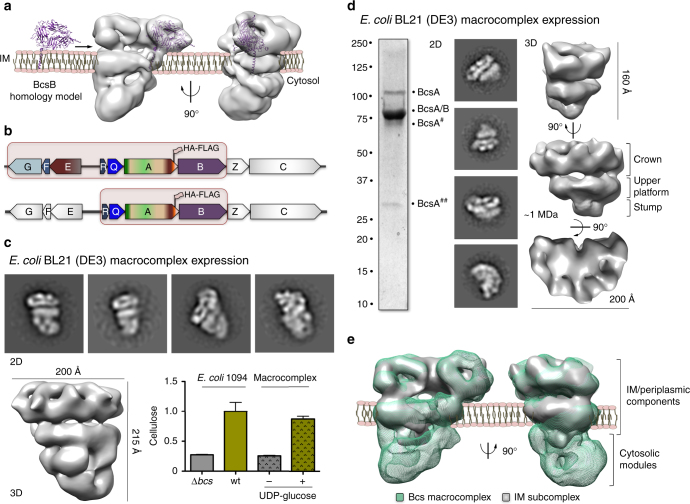
Fig. 3.
Map interpretation and electron microscopy studies of an inner membrane (IM) subcomplex. a Representative fitting of a BcsB homology model in a crown repeat volume and proposed orientation of the Bcs macrocomplex relative to the inner membrane. b Co-expressed subunits for recombinant overexpression and Bcs complex reconstitution in BL21 (DE3) cells (macrocomplex: top; IM subcomplex: bottom). c Structural and functional analyses of the recombinantly expressed Bcs macrocomplex. Representative 2D class averages are shown on the top (not to scale); the 3D structure reconstruction is shown on the bottom. End-point de novo cellulose synthesis by the purified complex is shown on the bottom; results are representative of two biological replicates. The data is plotted relative to cellulose detection in a wild-type E. coli 1094 cell culture, with bcs operon-deleted strain serving as negative control. d Structural analyses of the IM subcomplex. A coomassie-stained SDS-PAGE gel, 2D class averages (not to scale) and different views of the 3D structure reconstruction are shown from left to right. The corresponding molecular weight is indicated in megadaltons and the dimensions of the subcomplex are indicated by size bars. e. Fitting of the IM subcomplex into the Bcs macrocomplex volume and proposed orientation relative to the inner membrane

