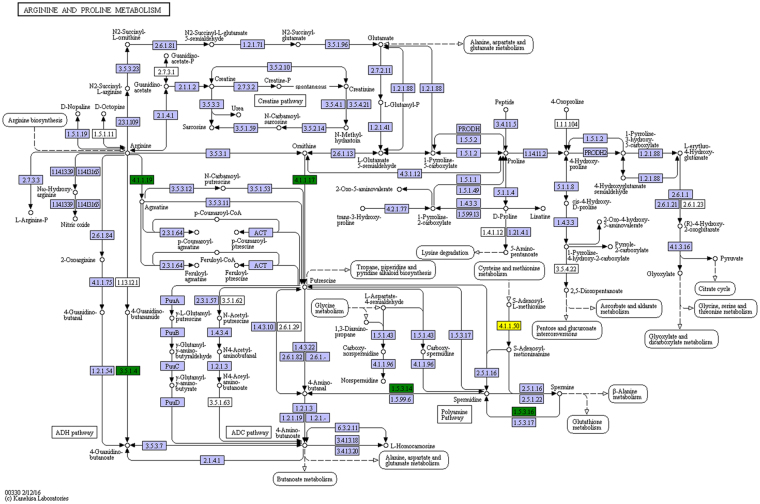
Figure 7.
Regulatory network of arginine and proline metabolisms. Green boxes and yellow box represent the enriched DEGs (green includes up-regulated gene, yellow includes both up-regulated and down-regulated genes). The pathway map without coloring is the original version that is manually drawn by in-house software named KegSketch. White boxes are hyperlinked to KO, ENZYME, and REACTION entries in metabolic pathways, and to KO and GENES entries in non-metabolic pathways. Purple boxes are hyperlinked to KO entries that are selected from the original version.

