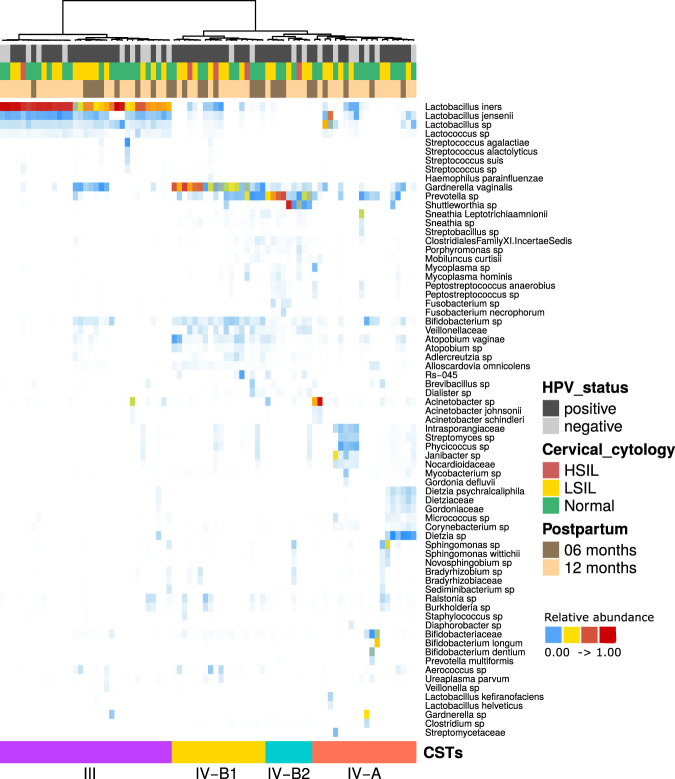
Figure 1.
Heatmap generated by unsupervised hierarchical clustering analysis of cervical microbiomes of the studied participants. CSTs were defined using clustering based on Bray-Curtis dissimilarity and average linkage and are shown in color-coded groups at the bottom and also by the dendrogram at the top of the Figure. HPV status, cervical cytology and postpartum period are also color-coded according to the legend at the right of the Figure. CST III is L. iners-dominant; CST IV-A has a low proportion of Lactobacillus and a high diversity; CST IV-B.1 is G. vaginalis-dominant and CST IV-B.2 is Prevotella-dominant. All taxa shown in the graph presented relative abundance >1%.

