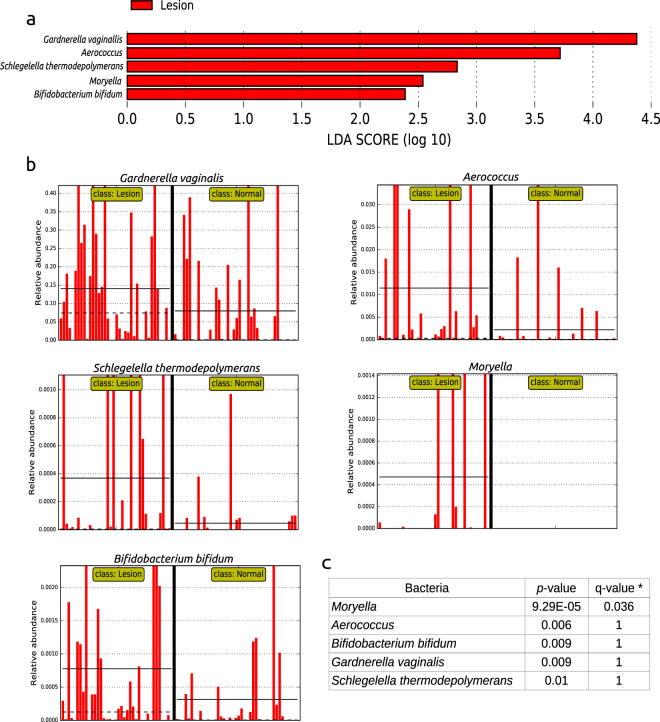
Figure 3.
Analysis of cervical lesion putative biomarkers using LEfSe. (a) Histogram of the LDA scores (log 10) showing bacteria that presented higher relative abundance in cervical lesions (red) when compared to normal cytology. Only statistically significant differences are shown. (b) Histograms showing the relative abundance of the five distinct taxa for each sample in the lesion and normal groups, separated by a thick black line. The solid and dotted black lines in the graphs indicate the mean and median relative abundance values for each group, respectively. The relative abundance (y-axis) is represented as a fraction of 1. (c) The p-values obtained by the LfESe analysis and the corrected p-values (q-values) are shown.

