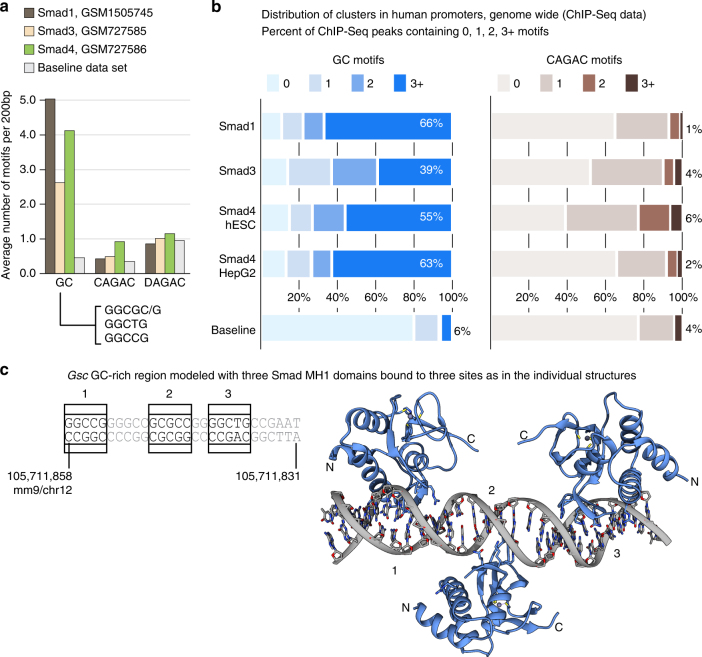
Fig. 7.
5GC motifs are enriched in nodal/TGF- β and in BMP-stimulated cells CREs. a Bar representation showing the average number of GC (GGCGC/G, GGCTG, and GGCCG), CAGAC, and DAGAC motifs found in 200 bp-regions of Smad1, Smad3, and Smad4 ChIP-Seq data up to 1000 bp from the TSS (shown in brown, beige, and green, respectively) or from the baseline data set (gray). AGAC motifs preceded by nucleotides different from C are included under the DAGAC name. b Stacked bar plots showing the number of motifs per 200 bp region (as %) found in Smad1, Smad3, and in Smad4-bound ChIP-Seq data, considering the promoter regions as above. Smad4 data corresponding to HepG2 cell lines are shown for comparison of the distribution of motifs to ES. Regions are classified as 0, 1, 2, 3, or more sites. Left: GGCGC/G, GGCCG, GGCTG sites together vs. baseline, colored in blue. Right: CAGAC motifs vs. baseline, colored in brown. c Model of the GC region with the three Smad DNA structures determined. Although based on the sequence, there is an additional potential binding site in this region, only three binding sites are available. Once the first domain is bound (in one of the places), there are only two more sites accessible. With this arrangement, there is no direct contacts between the MH1 domains

