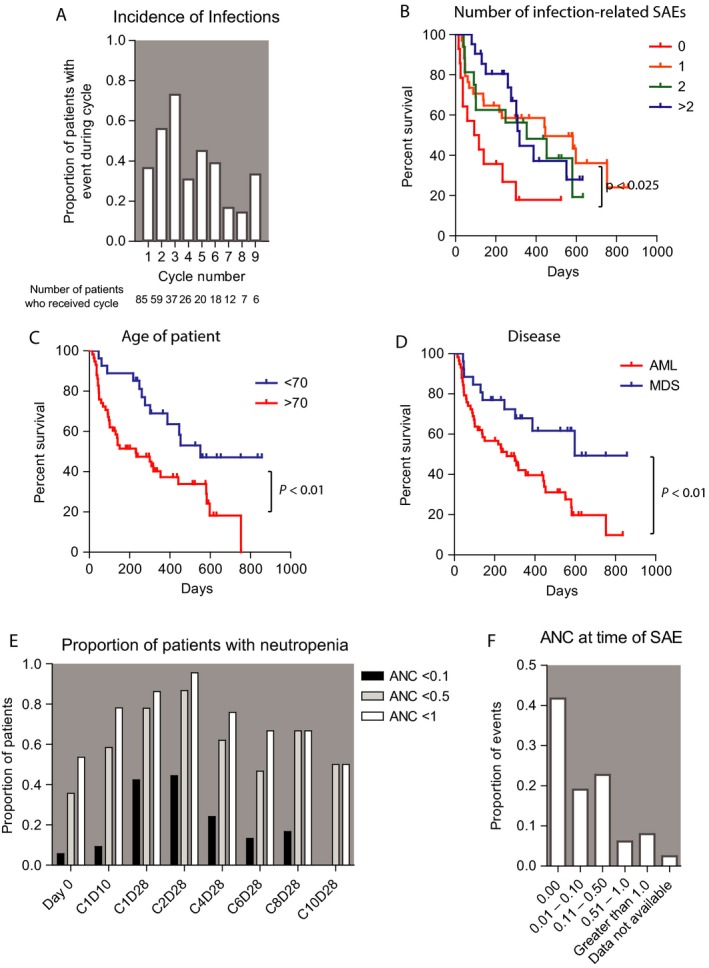
Figure 1.

Correlation of infection events with clinical features. (A) The incidence of infection‐related events occurring within each cycle of therapy, restricted to cycle numbers received by at least five patients. (B) Overall survival correlation with the number of infection‐related SAEs a patient experienced during therapy. (C and D) Correlation of age and disease with overall survival. P values indicate results of log‐rank test. (E and F) Absolute neutrophil count (ANC) at the schedule bone marrow biopsies and at the time of infection‐related SAEs (ANC values indicate 109 neutrophils per liter).
