
Figure 8.
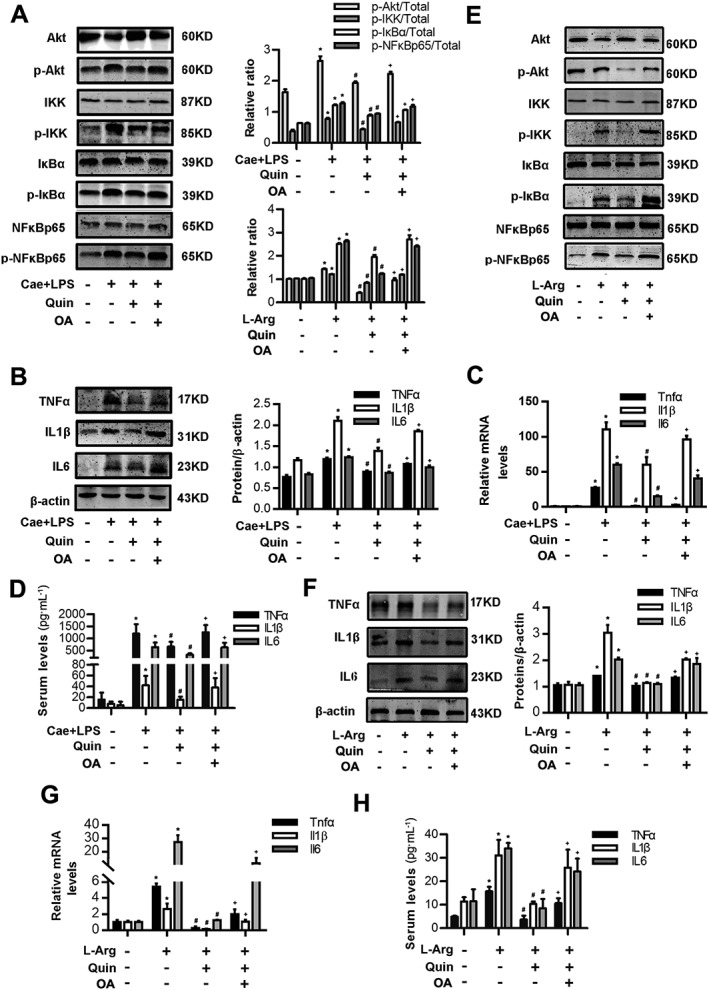
D2 receptor signalling inhibits NF‐κB activation via a PP2A‐dependent Akt signalling pathway in AP in vivo. Two models of AP were induced in Balb/C mice in vivo (see Methods section). Mice were pretreated with quinpirole (10 mg·kg−1, i.p., 0.5 h before the first caerulein injection) with or without okadaic acid (100 ng per mouse, i.p., 0.5 h before quinpirole). Mice were killed at 12 h after the first caerulein injection and at day 3 after the second L‐Arg injection. (A) Immunoblot analysis of Akt, IKK, IκBα and NF‐κBp65 phosphorylation levels of pancreatic tissue in mice of caerulein‐ and LPS‐induced AP. (B) Immunoblot analysis of TNFα, IL‐1β and IL‐6 levels of pancreatic tissue in mice of caerulein‐ and LPS‐induced AP. (C) qRT‐PCR of mRNA levels of Tnfα, Il1β and Il6 of pancreatic tissue in mice of caerulein‐ and LPS‐induced AP. (D) ELISA of serum TNFα, IL‐1β and IL‐6 levels in mice of caerulein‐ and LPS‐induced AP. (E) Immunoblot analysis of Akt, IKK, IκBα and NF‐κBp65 phosphorylation levels in pancreatic tissue in mice of L‐Arg‐induced AP. (F) Immunoblot analysis of TNFα, IL‐1β and IL‐6 levels in pancreatic tissue in mice of L‐Arg‐induced AP. (G) qRT‐PCR of mRNA levels of Tnfα, Il1β and Il6 in pancreatic tissue in mice of L‐Arg‐induced AP. (H) ELISA of serum TNFα, IL‐1β and IL‐6 levels in mice of L‐Arg‐induced AP. n = 6 per group. Cae, caerulein; L‐Arg, L‐Arginine. *P < 0.05 versus NC, # P < 0.05 versus AP and + P < 0.05 versus quinpirole.