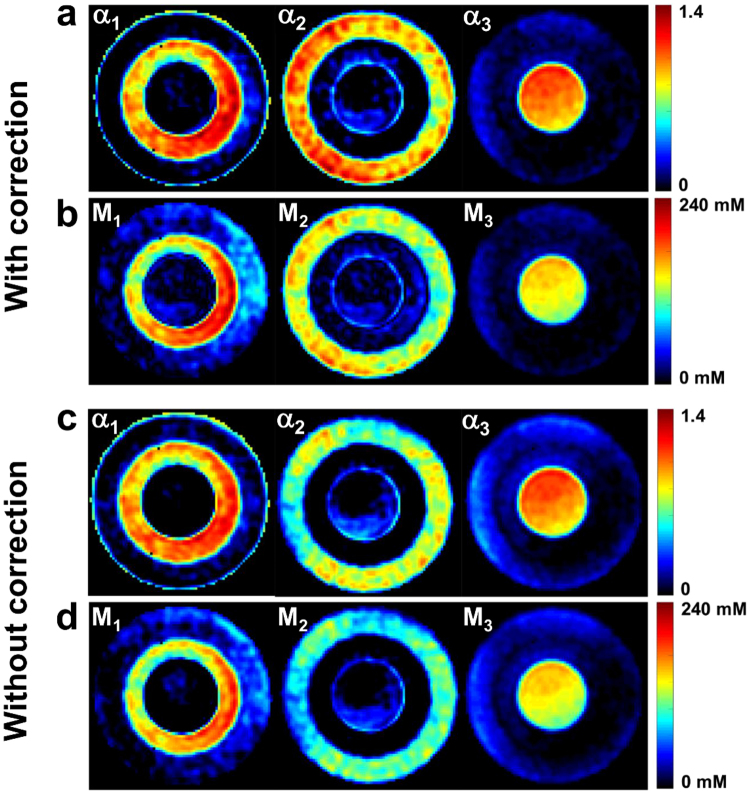
Figure 5.
Example of sodium data quantification and filtering in phantom, with and without frequency offset and correction. (a) Volume fractions α 1, α 2. and α 3 with correction. (b) Apparent total concentrations M 1, M 2, and M 3 with correction. (c) Volume fractions α 1, α 2. and α 3 without correction. (d) Apparent total concentrations M 1, M 2, and M 3 without correction. Compartment-wise ROI evaluations generate mean values ± standard deviation of α 1 = 0.82 ± 0.12, α 2 = 0.99 ± 0.11, α 3 = 1.01 ± 0.07, M 1 = 129 ± 30 mM, M 2 = 139 ± 15 mM, M 3 = 140 ± 10 mM when frequency offset and correction was included in the quantification, and α 1 = 0.97 ± 0.13, α 2 = 0.70 ± 0.12, α 3 = 0.99 ± 0.09, M 1 = 143 ± 29 mM, M 2 = 97 ± 16 mM, M 3 = 139 ± 12 mM without correction.

