Figure 4.
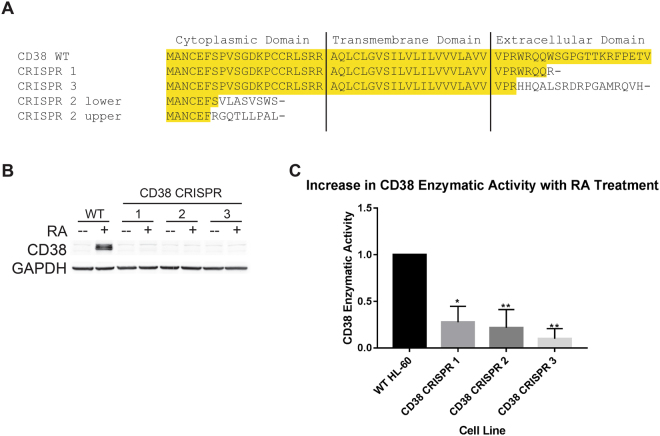
Disruption of CD38 using the CRISPR/Cas9 system. (A) Sequence alignment comparing the CD38 amino acid sequence of each CRISPR-derived cell line, up to the first stop codon, to wild-type CD38. Highlight denotes sequence matching wild-type CD38. The CRISPR 2 line is a mixed population expressing two different CD38 truncations. (B) Western blot of CD38. Wild-type and CRISPR-derived cell lines were treated with 1 μM RA as indicated for 48 h and whole cell lysate was collected. 25 μg of lysate per lane was run. Membrane images for each protein are cropped to show only the band of interest. (C) CD38 enzymatic activity assay. Wild-type and CRISPR cell lines were cultured for 48 h with 1 μM RA as indicated to stimulate CD38 expression and evaluated for cGDPR production via an NGD+ assay (n = 4). The difference in fold increase between RA treated and untreated samples was taken for each cell line and normalized to a control value of 1 in wild-type cells. Error bars indicate SEM. *p < 0.05; **p < 0.01. One-way ANOVA using Tukey’s multiple comparisons test was used to determine significance. The raw data NGD+ catabolism curves are shown in Supplementary Information.

