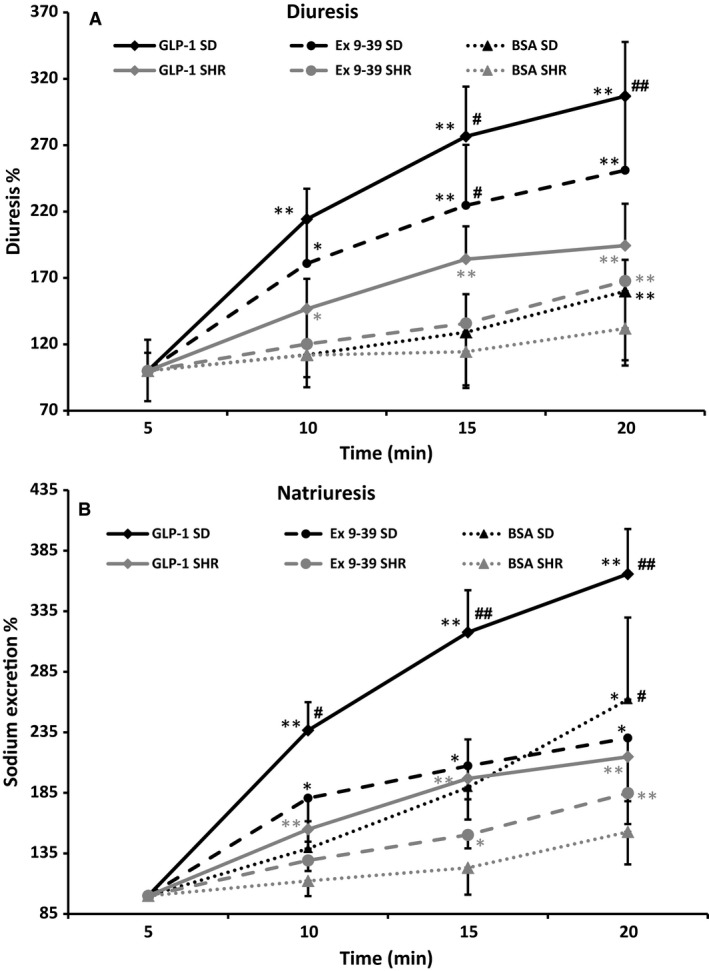
Figure 4.

Changes in urine and sodium excretion in SD and SHR rats after intrarenal infusion of 1% BSA (n = 6 and n = 5), 1 nmol/L GLP‐1 (n = 19 and n = 10), GLP‐1 and exendin 9‐39 (100 nmol/L; n = 6 and n = 6). *P < 0.05 versus time 0; **P < 0.01 versus time 0; #P < 0.05 SD versus SHR within same treatment group; ##P < 0.01 SD versus SHR within same treatment group.
