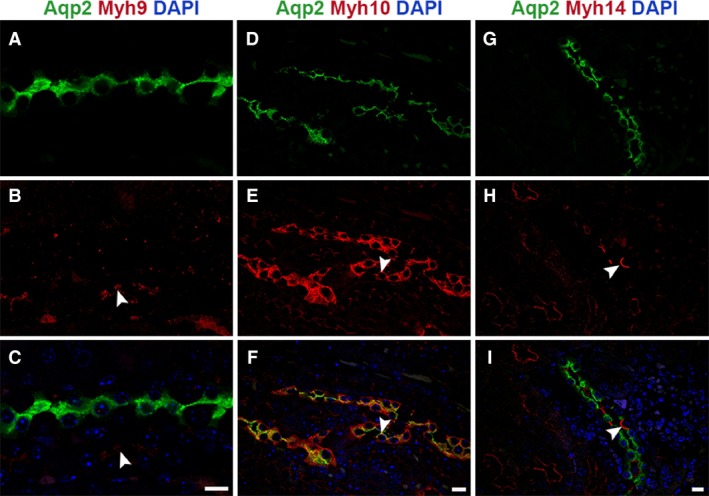
Figure 5.

Myh10 and Myh14 isoforms show unique expression and localization pattern in the collecting duct. Kidney sections were stained with Aqp2 to identify the collecting duct segment and costained for the NM2 isoforms. Analysis showed that Myh9 (A–C) was not present in the collecting duct, Myh9 staining was present in the adjacent tubule (arrowhead). Myh10 (D–F) was the most abundant of the isoforms expressed in the collecting duct and localized to apical (arrowhead) and basolateral membrane as well as cell–cell adhesions. Myh14 (G–I) expression in the collecting duct was limited to the apical membranes (arrowhead) of cells not expressing Aqp2 (intercalated cells). Sections were mounted with vectashield containing DAPI to stain the nucleus (blue; C, F, and I). Scale bar = 10 μm.
