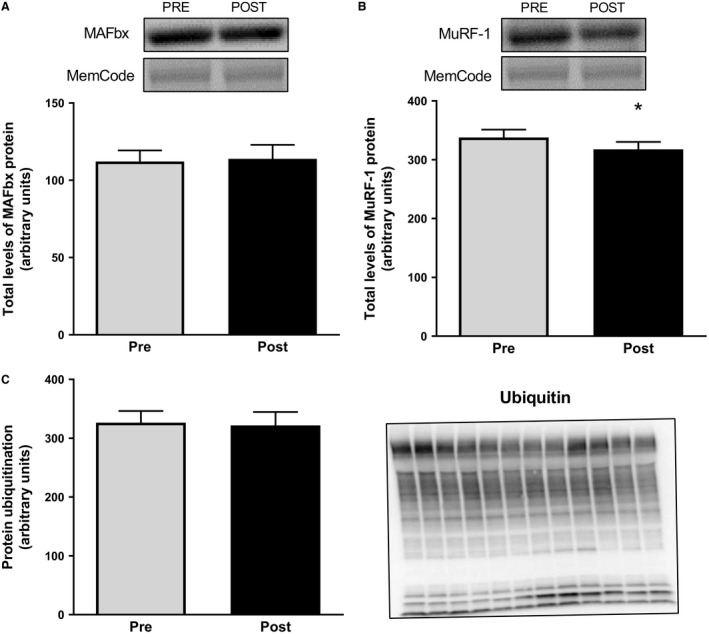
Figure 4.

Total protein levels of MAFbx (A) and MuRF‐1 (B) as well as total protein ubiquitination (C) in muscle biopsies taken before and after the operation. Representative blots are shown above the graphs for MAFbx and MuRF‐1, and on the right of the graph for ubiquitination. The latter show lanes with Pre and Post samples alternating from left to right. The values presented are means ± SE for 13 subjects. *P < 0.05 versus Pre, evaluated by Student's paired t‐test.
