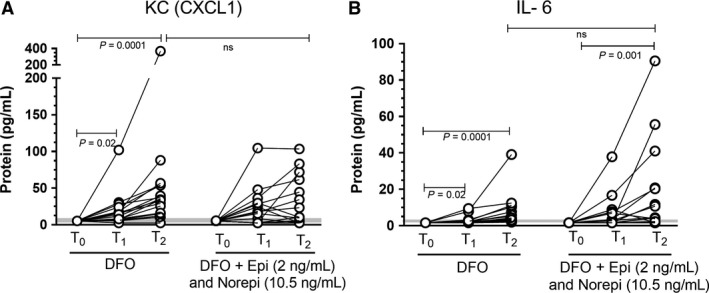
Figure 2.

Changes in keratinocyte chemoattractant, CXCL1, and interleukin‐6 (IL‐6) to combined treatment with DFO or DFO+ EPI and norepinephrine (NOREPI). N = 15–16 in each group. P values within treatment groups are post hoc comparisons. Tests were also performed on differences in the amount of cytokine secreted at T2, in the control versus EPI/NOREPI treated tissues. See Table 1 for Medians ±25–75% quartiles. Shaded line is centered on the median at the 25–75% quartiles for the baseline control. EPI, epinephrine; DFO, deferoxamine.
