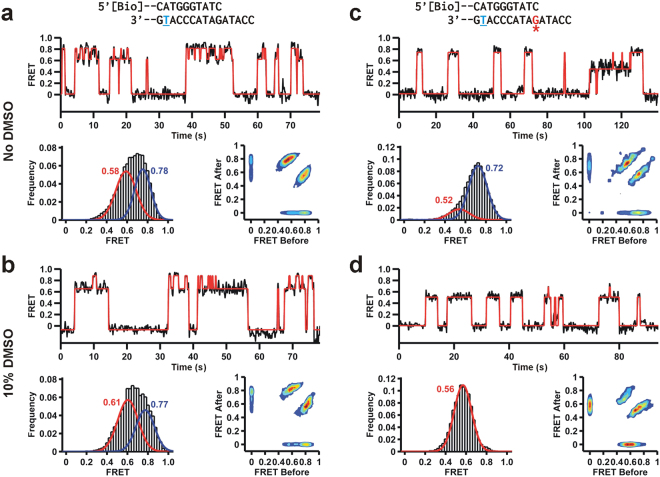
Figure 5.
Dpo4 binding dynamics to the DNA where the primer terminates across the adduct. Red line shows HHM fit. (a) Dpo4 binding to the unmodified DNA in the absence of DMSO. Characteristic FRET trajectory (top), histogram (bottom left) with bimodal fit and transition density plot (TDP, bottom right). (b) Dpo4 binding to the unmodified DNA in the presence of 10% DMSO. Characteristic FRET trajectory, and resulting histogram and transition density plot (TDP). (c) Dpo4 binging to the adducted DNA in the absence of DMSO. Characteristic FRET trajectory, and resulting FRET histogram and TDP. (d) Dpo4 binging to the adducted DNA in the presence of 10% DMSO. Characteristic FRET trace, FRET histogram and TDP.

