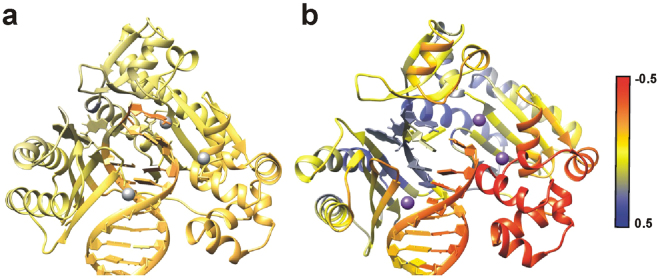
Figure 8.
Difference correlation analysis relative to the adducted B[a]P-dG residue. Red denotes an increase in anticorrelation, yellow denotes no difference in correlation, and blue denotes an increase in correlation. The color scale has been rescaled to a range of −0.5 to 0.5 for clarity. (a) The difference in correlation between B[a]P-dG:dC in pure water and B[a]P-dG:dG in pure water relative to the adducted residue with the calcium ions colored in gray. (b) The difference in correlation between B[a]P-dG:dC in 10% DMSO/90% water with a solvent-exposed adduct conformation and B[a]P-dG:dC in pure water with the calcium ions colored in purple.

