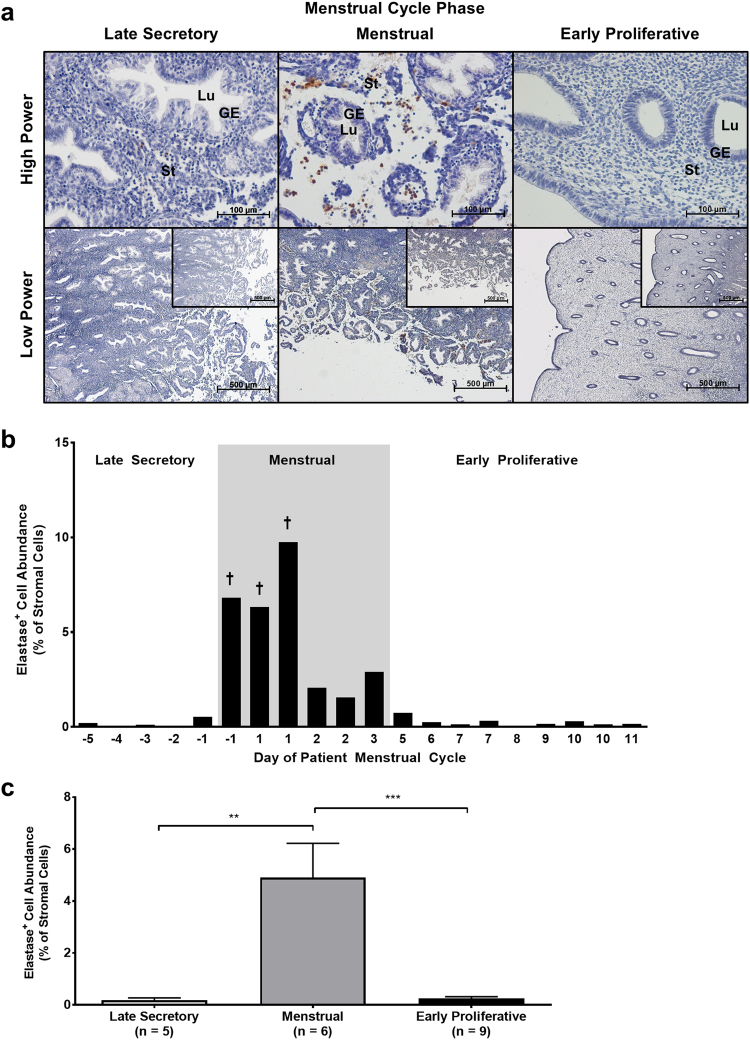
Figure 4.
Neutrophil abundance peaks at the onset of menstruation in the human endometrium. Neutrophil abundance was analysed by immunohistochemistry and ImageJ-assisted stereology. (a) Representative photomicrographs of endometrial tissue sections at high power and low power with isotype control insets. GE = glandular epithelium, Lu = lumen, St = stroma. (b) Percentage of endometrial stroma comprised by elastase-immunopositive cells (normalised to total cell nuclei) plotted against day of patient menstrual cycle. Each x-value represents data from one individual patient sample, therefore some cycle days are repeated. † symbol indicates %SE (standard error) < 5. Dark grey box indicates the period of menstruation. (c) Stromal neutrophil abundance grouped by menstrual cycle phase. Results are presented as mean ± SEM, with results consistent across three technical replicates. Significance determined by 1-way ANOVA and Tukey’s multiple comparisons test. **p < 0.01, ***p < 0.001.

