
Figure 1.
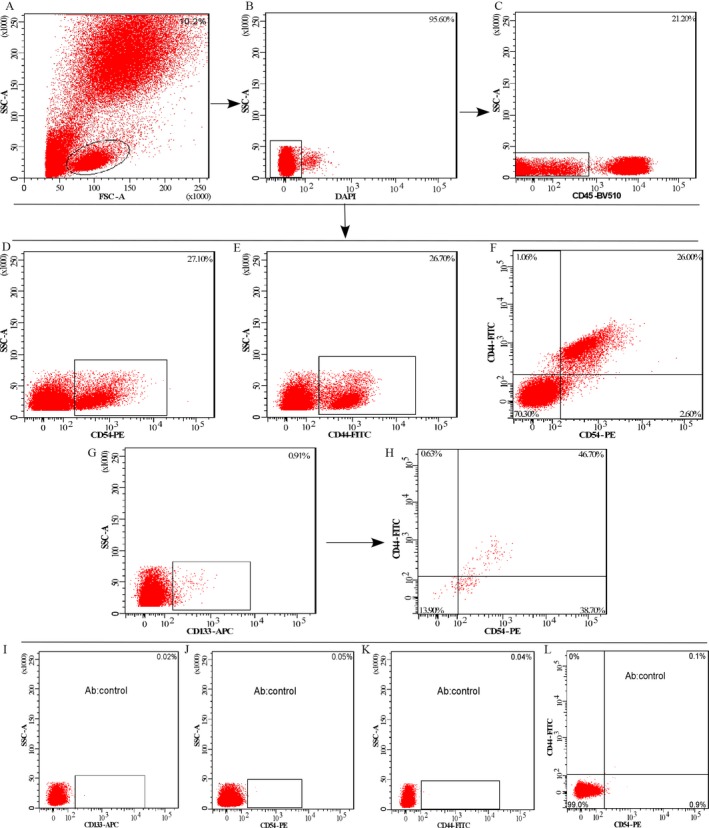
Expression of the cellular subpopulation of circulating tumor cells in the peripheral blood of circulating tumor cells (CTCs). (A) The gating strategy to detect cellular subpopulations in whole blood or blood depleted of hematopoietic cells by fluorescence‐activated cell sorting (FACS). (B, C) The gating strategy to sort DAPI − CD45− cells, (D–H) the plots are gated on DAPI − CD45− cells. The contour plots show the expression of CD54+, CD44+, CD54+ CD44+, CD133+, and CD133+ CD54+ CD44+ cellular subpopulations of CTCs in the peripheral blood of colorectal cancers, respectively. The percentages of cells are indicated for each gate or plot quadrant. (I–L) The AB control for each marker, respectively, or individually.