
Figure 4.
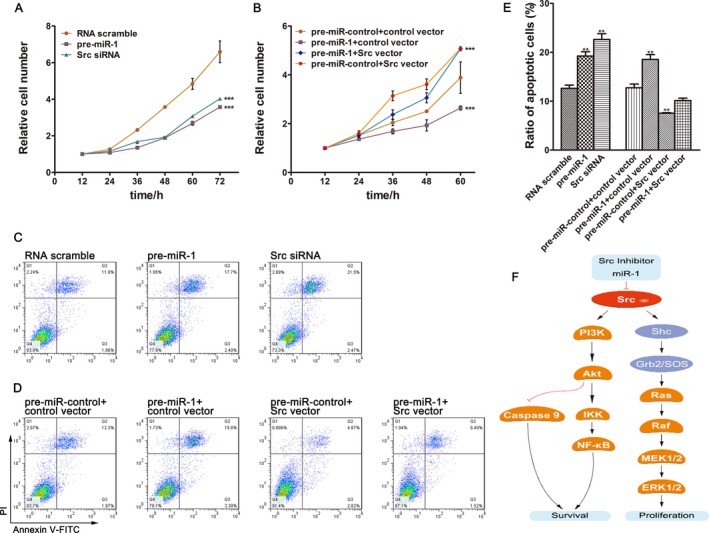
Roles of miR‐1 and Src in proliferation and apoptosis of esophageal cancer cells. (A) Growth curves of TE‐1 cells transfected with equal doses of the miR‐1 mimics or Src siRNA or scrambled control RNA. (B) Growth curves of TE‐1 cells transfected with the control mimic plus control vector or miR‐1 mimic plus control vector or miR‐1 mimic plus Src overexpression vector (Src vector) or control mimic plus Src overexpression vector. (C) Representative images of ratio of apoptotic TE‐1 cells transfected with equal doses of the miR‐1 mimics or Src siRNA or scrambled control RNA. (D) Representative images of ratio of apoptotic TE‐1 cells transfected with the control mimic plus control vector or miR‐1 mimic plus control vector or miR‐1 mimic plus Src overexpression vector or control mimic plus Src overexpression vector. (E) Quantitative analysis of the flow cytometry analysis of (C and D). (F) Model of miR‐1 enhances apoptosis and suppresses proliferation by targeting Src to restrain tumor growth in esophageal cancer.