Figure 1.

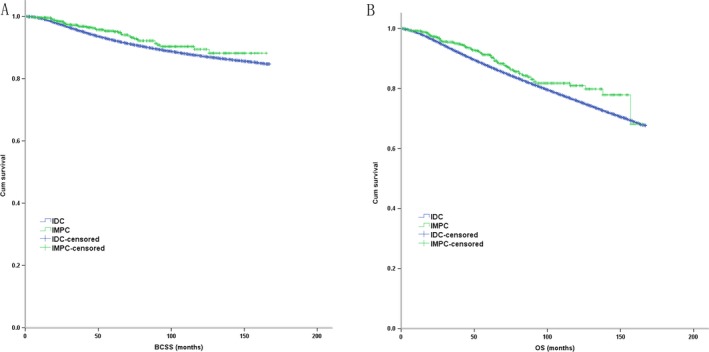
The Kaplan–Meier survival curves of BCSS and OS stratified by the histologic type of IMPC (n = 984) and IDC (n = 317 478) in the comparison based on large population database ((A): BCSS; (B) OS).

The Kaplan–Meier survival curves of BCSS and OS stratified by the histologic type of IMPC (n = 984) and IDC (n = 317 478) in the comparison based on large population database ((A): BCSS; (B) OS).