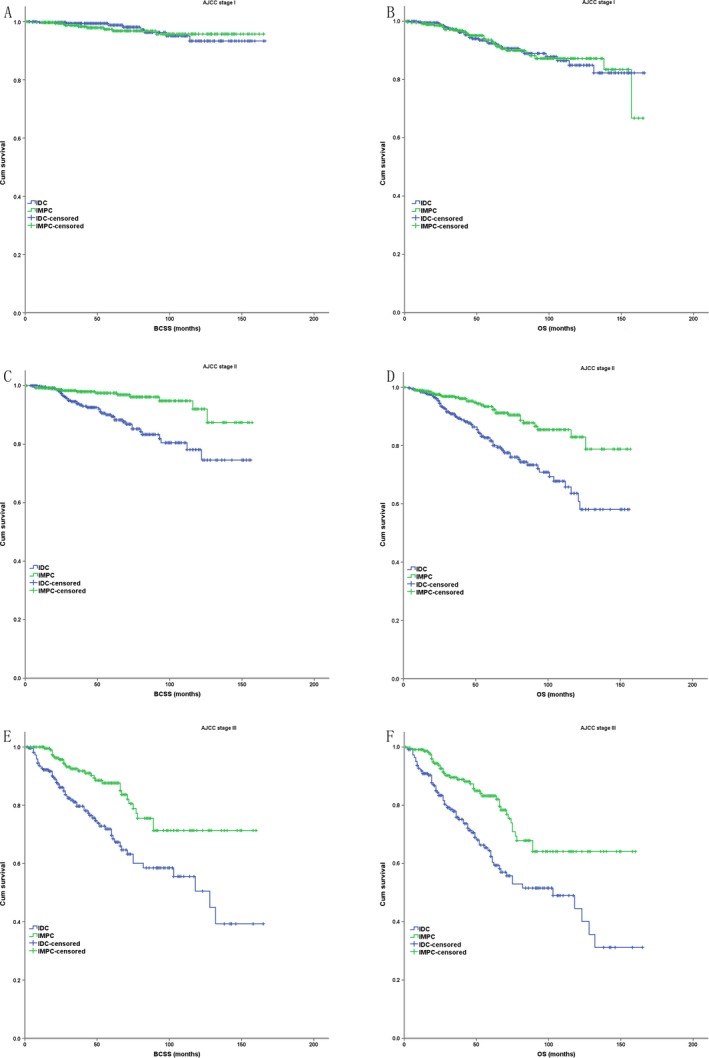
Figure 3.

The Kaplan–Meier survival curves of BCSS and OS for the IMPC and IDC stratified by AJCC stage in case–control analysis ((A) BCSS in stage I; (B) OS in stage I; (C) BCSS in stage II; (D) OS in stage II; (E) BCSS in stage III; (F) OS in stage III).
