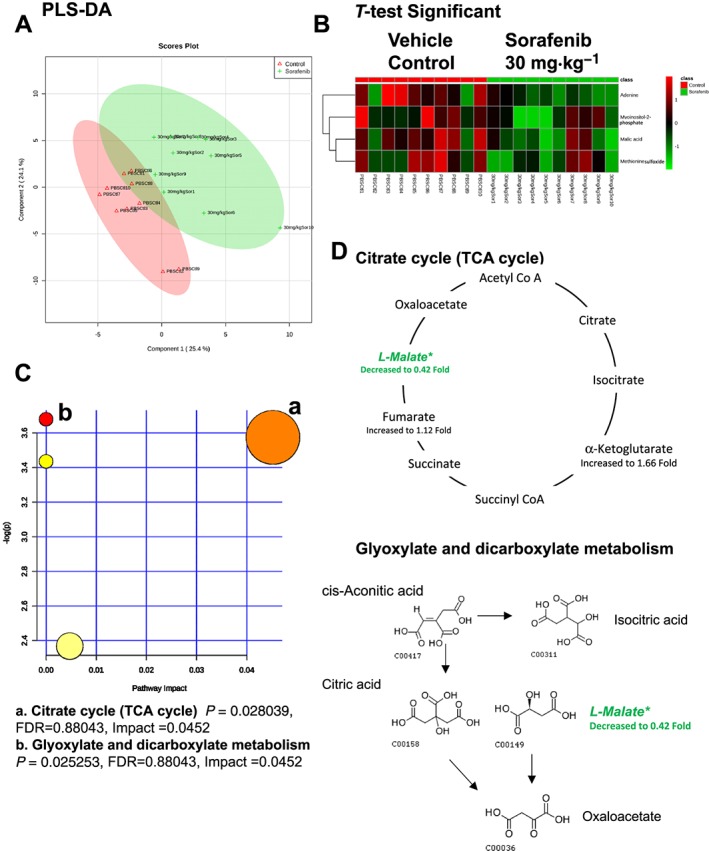
Figure 8.

Analysis of non‐targeted metabolomics of plasma from sorafenib‐treated mice compared to vehicle‐treated mice. (A) PLS‐DA of plasma metabolites from sorafenib‐treated mice compared to vehicle control mice plotted on two principal components. (B) Heatmap of significant (as assessed by t‐test) metabolites in plasma from sorafenib‐treated mice. (C) Pathway analysis of significant metabolites. (D) Overview of the citrate cycle, the glyoxylated and dicarboxylate metabolism and the context of the significant metabolites identified in sorafenib‐treated plasma.
