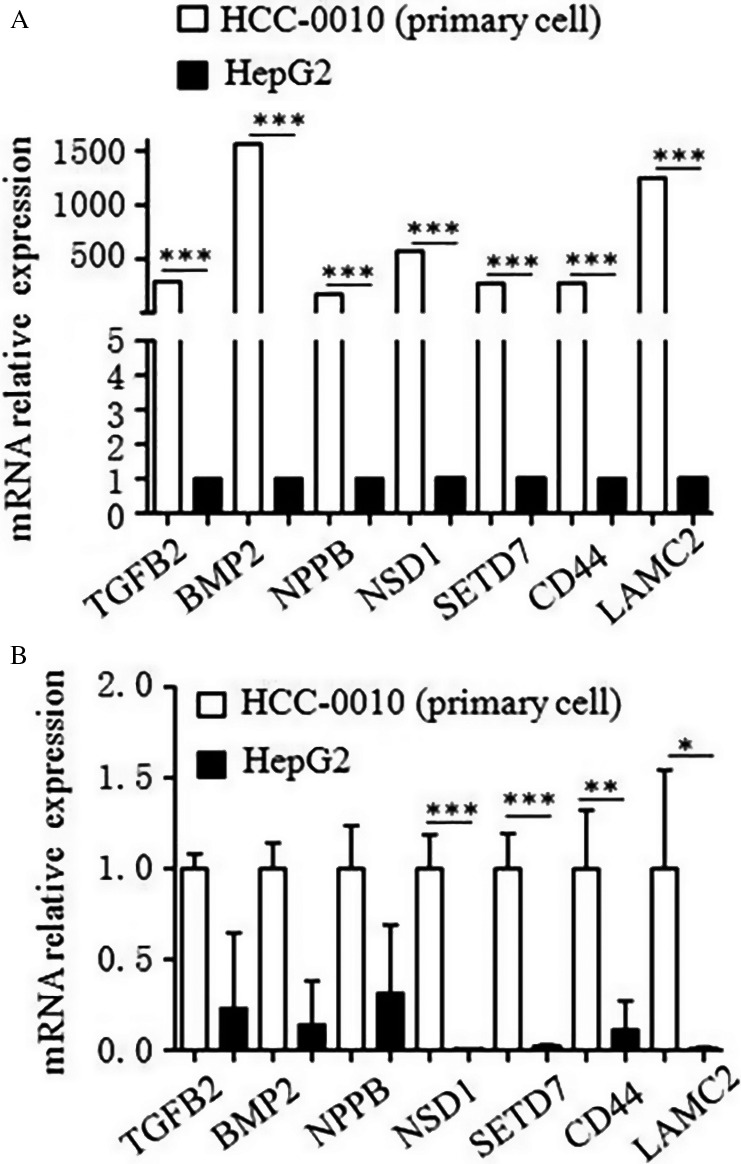
Figure 5.

Gene expression was different between HepG2 cells and HCC‐0010 cells by RNA‐seq. (A) RNA‐seq was used to discover gene expression changes with Sorafenib treatment. (B) Real‐time qPCR was used to verify the results of RNA‐seq in cell lines (mean±SEM; *P<0.05; **P<0.01; ***P<0.001).
