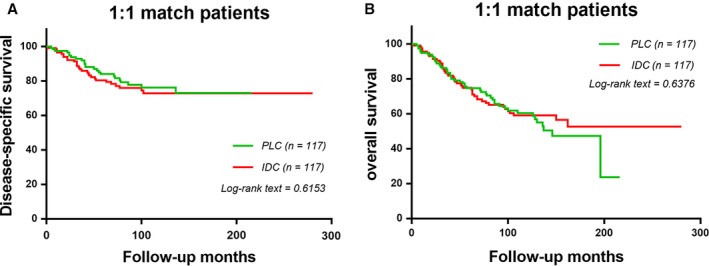
Figure 2.

The disease‐specific survival and disease‐overall survival of 1:1 matched groups of PLC patients and IDC patients. Kaplan–Meier test for disease‐specific survival (χ 2 = 0.2525, P = 0.06153, Fig. 2A) and disease‐overall survival. (χ 2 = 0.2219, P = 0.6376, Fig. 2B) to compare 1:1 matched groups of PLC patients and IDC patients.
