Figure 3.

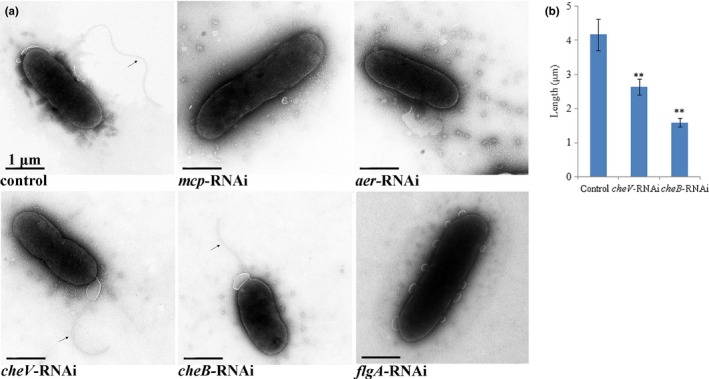
(a) Transmission electron micrographs of stably silenced ND‐01 cells. (b) Length of the flagella of control, cheV‐RNAi and cheB‐RNAi cells. Data are presented as the means ± SD; **p < .01 compared with the control

(a) Transmission electron micrographs of stably silenced ND‐01 cells. (b) Length of the flagella of control, cheV‐RNAi and cheB‐RNAi cells. Data are presented as the means ± SD; **p < .01 compared with the control