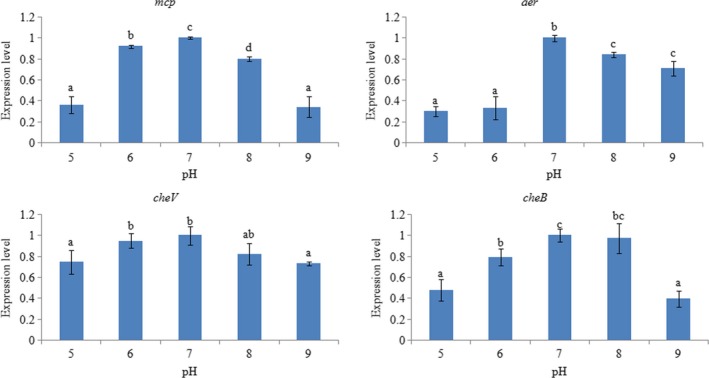
Figure 6.

qRT‐PCR analysis of mcp, aer, cheV, and cheB expression in ND‐01 grown at various pH levels. Data are presented as the means ± SD, and each treatment consisted of six independent biological replicates. The means of treatments not sharing a common letter are significantly different at p < .05
