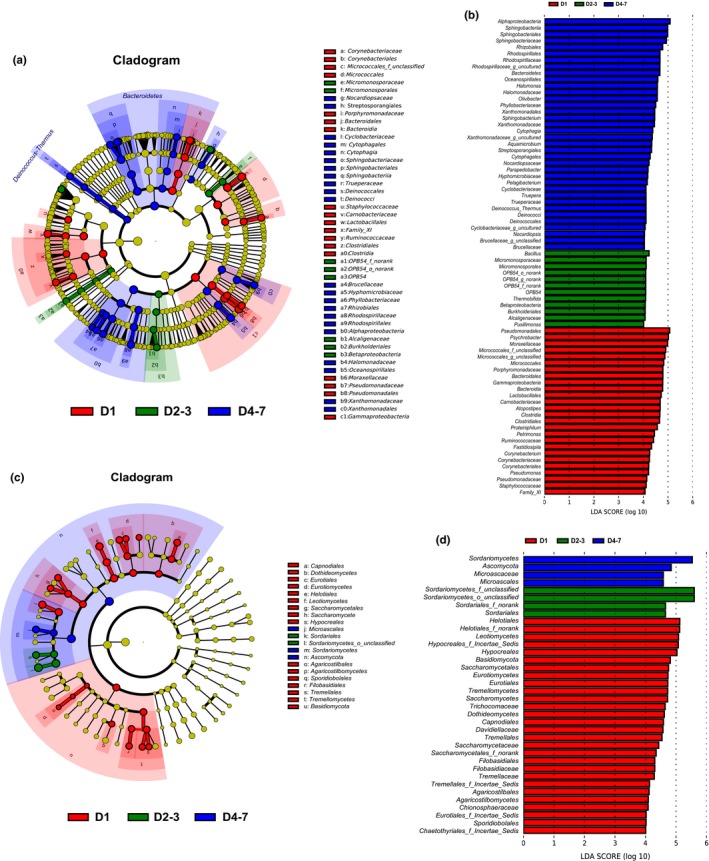
Figure 4.

Cladogram showing the phylogenetic distribution of the bacterial and fungal lineages associated with compost in the three different stages of composting (a and c). Indicator bacteria with linear discriminant analysis scores of ≥4 in bacterial and fungal communities associated with compost in the three different stages of composting (b and d). Different‐colored regions represent different stages (red, D1; green, D2–3; blue, D4–7). Circles indicate phylogenetic levels from domain to genus. The diameter of each circle is proportional to the abundance of the group
