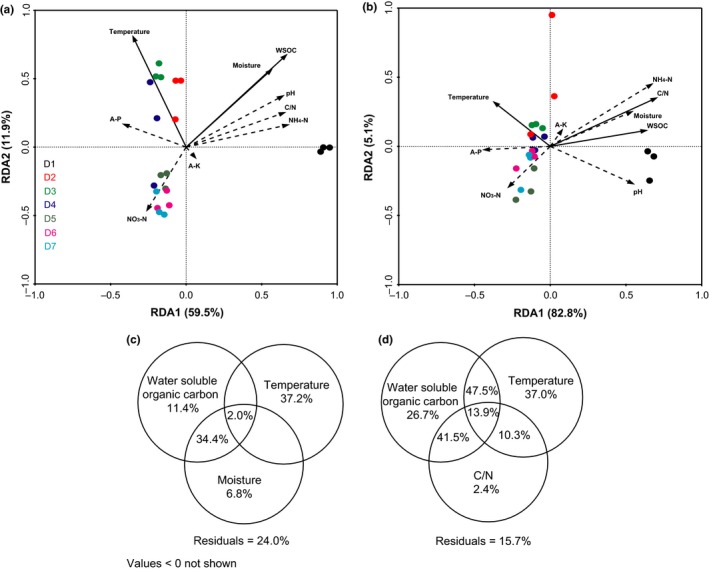
Figure 5.

Redundancy analysis of MiSeq data (symbols) and environmental characteristics (arrows). Bacterial and fungal communities are shown in a and b, respectively. The values of axes 1 and 2 are the percentages explained by the corresponding axis. Analysis of the level of contribution of significant factors (solid arrows) to changes in bacterial (c) and fungal (d) communities
