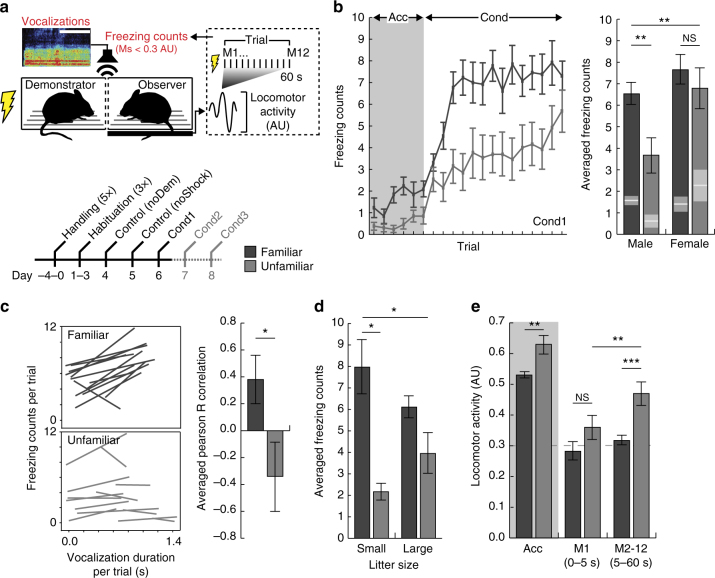
Fig. 1.
Unfamiliar male mice exhibit a reduction in socially transmitted fear. a Schematic of the socially transmitted fear paradigm (AU, arbitrary unit; M, measurement; scale bar, 100 ms), and schedule (Acc, acclimation; Cond, demonstrator conditioning). b Unfamiliar male observers (gray, n = 13) exhibited significantly less freezing compared to familiar male observers (black, n = 13) across demonstrator conditioning trials (repeated measure ANOVA: F 1,390 = 6.00, p < 0.0001), and when averaged (two-tailed Student’s t-test: t(25) = 2.96, p = 0.008). Familiar (black, n = 10) and unfamiliar (gray, n = 10) female mice did not exhibit significant differences in levels of freezing (two-tailed Student’s t-test: t(19) = 0.728, p = 0.48) (ANOVA: F 3,45 = 5.55, p = 0.003; effect of familiarity F 1,45 = 6.06, p = 0.018; effect of sex F 1,45 = 7.83, p = 0.008; familiarity x-sex interaction F 1,45 = 1.76, p = 0.192). The gray box indicates the acclimation period prior to demonstrator conditioning. White lines and gray boxes within bars indicate mean and s.e.m. of freezing counts, respectively, during acclimation. c The relationship between observer freezing counts and demonstrator vocalization durations across conditioning trials in familiar and unfamiliar mice. Average correlations were significantly different (Fisher transformation, two-way Student’s t-test: t(24) = 2.25, p = 0.035). d Socially transmitted fear differed between familiar (black; small: n = 3, large: n = 10) and unfamiliar (gray; small: n = 2, large: n = 11) male mice when the observer was reared within a relatively small litter (small: 2–6 pups; large: 7–12 pups) (ANOVA: F 3,25 = 3.69, p = 0.027; effect of familiarity, F 1,25 = 10.28, p = 0.004; effect of size F 1,25 = 0.001, p = 0.970; familiarity x-size interaction, F 3,25 = 2.16, p = 0.156; two-tailed Student’s t-test: small litters only, t(4) = 4.38, p = 0.035). e Locomotor activity measurements recorded during acclimation, and over the first 5 s (M1) or thereafter (M2-12) demonstrator foot-shock trials were significantly different in unfamiliar observers (two-tailed Student’s t-test: effect of measurement t(25) = 3.70, p = 0.002), and in unfamiliar compared to familiar observers at M2-12 (two-tailed Student’s t-test: effect of familiarity t(25) = 3.96, p = 0.001), indicating less sustained freezing within trials. The dashed line indicates locomotor activity threshold used for freezing counts, as in b. Error bars represent s.e.m. *p < 0.05; **p < 0.01; ***p < 0.001; NS = not significant

