Fig. 2.
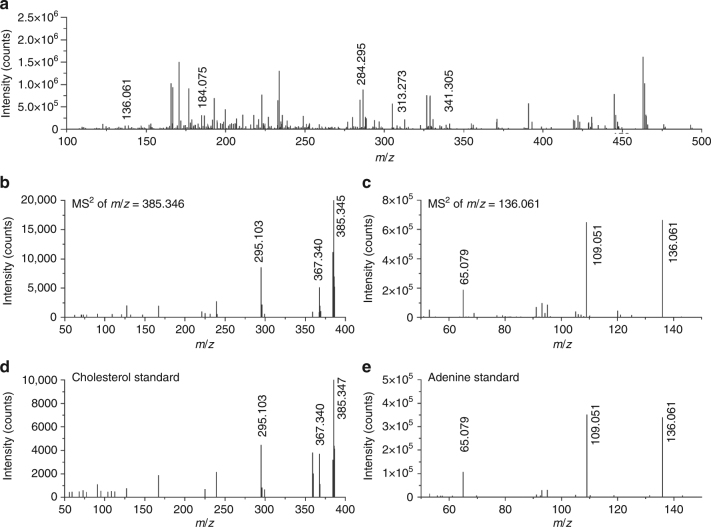
AP-nanoPALDI mass spectra from a mouse hippocampal tissue slice and standard materials in the positive ion mode. a Mass spectra from a mouse hippocampal tissue slice in the range of m/z = 100–500. The plasma background has been subtracted from the spectra. AP-nanoPALDI MS/MS of b compound at m/z = 385.346 in the hippocampal tissue slice, c compound at m/z = 136.061 in the hippocampal tissue slice, d standard cholesterol, and e standard adenine

