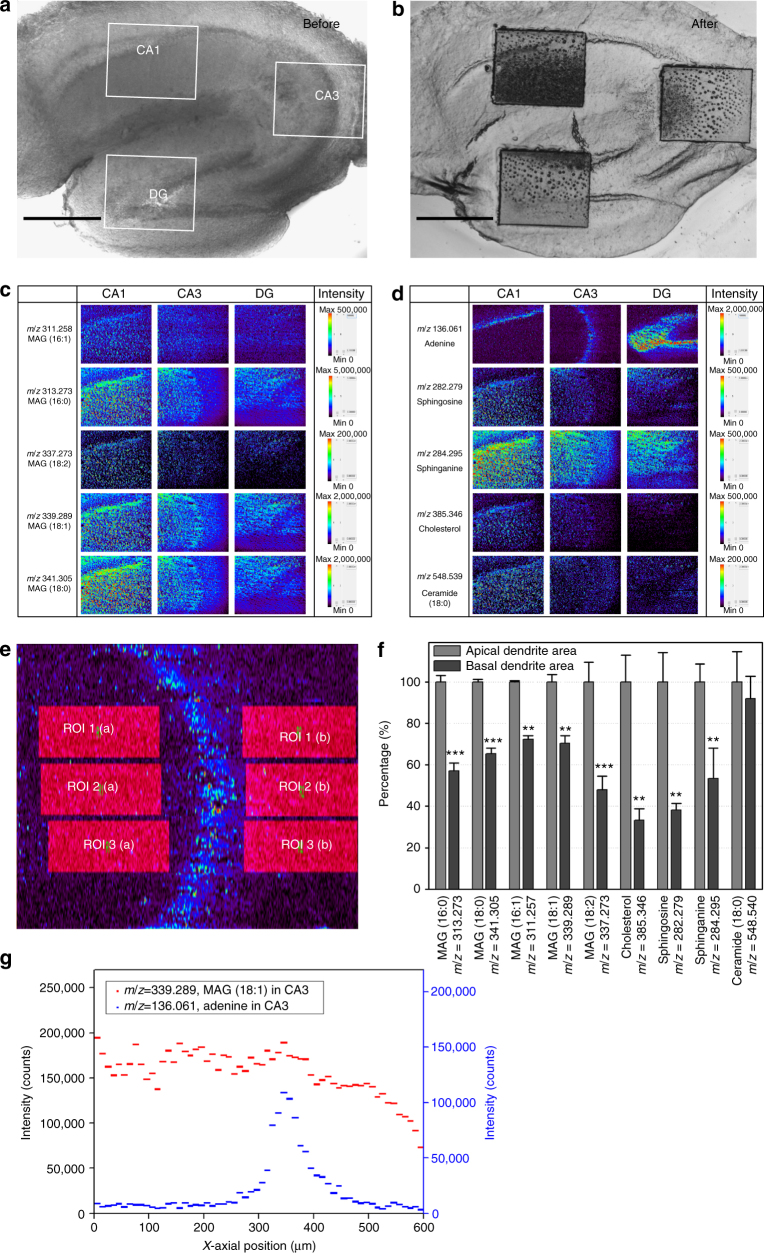
Fig. 4.
Spatial distribution of detected ions with sub-regions of a mouse hippocampal tissue by MS imaging. Two optical images indicated three analysis regions of CA1, CA3, and DG; a before the MS analysis and b after MS analysis. Scale bars, 500 μm. c, d identified ion images were compared with CA1, CA3, and DG. Ion images were generated with 433 × 100 pixels covering an area of 600 × 500 µm, and the corresponding x-axial and y-axial pixel sizes were 1.4 and 5 µm, respectively. According to experiment, the ion images had x-axial and y-axial lateral resolutions of 2.9 and 5 µm, respectively (Fig. 5). e Six identical ROIs were assigned to each side based on adenine boundary of CA3 using the function of ROI analysis in BioMap software. The three left areas indicate the apical dendrite areas and the three right areas indicate the basal dendrite areas. f Relative proportions of detected ions, where the intensities of apical dendritic populated areas were normalized to 100% (raw data is shown in Supplementary Table 1). Shown are means ± SDs from nine independent ions in each of the three regions. Asterisks indicated P values. **P < 0.01; ***P < 0.001. g Distribution of ion intensities of MAG (18:1) in c, and adenine in d, along x-axial position. The values of graph represented averages of forty y-axial values per each x-position (middle 40 lines of 100 lines in y-direction) and also averages per 10 µm along the x-direction, from 0 to 600 µm

