Fig. 5.
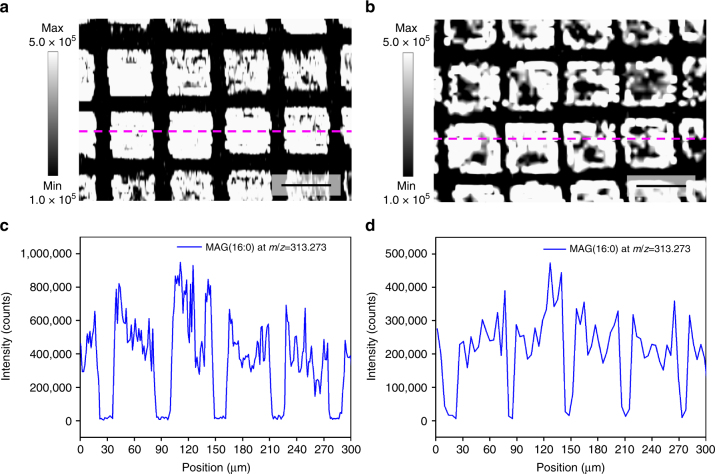
The x-axial lateral resolution test of AP-nanoPALDI imaging in a hippocampal specimen on 400 mesh grid. Ion images for MAG (16:0) ion at m/z = 313.273 were taken during the analysis of the hippocampal tissue slice (the area of 300 × 200 µm) on a TEM grid with 400 mesh when the sample moving velocities were set to a 10 µm s−1 and b 30 µm s−1, respectively. Scale bars, 50 μm. The line scans were obtained from the MAG (16:0) ion image at the average of the three neighboring scan lines (magenta dashed line). The resulting line scan (c) corresponds with ion image (a), and line scan (d), corresponds with ion image (b). As a result, the x-axial lateral resolutions achieved were 2.9 ± 0.6 and 5.1 ± 1.1 µm when the sample moving velocities were 10 and 30 µm s−1, respectively. They represented means ± SDs from 10 distinct edges in each case as shown in c and d

