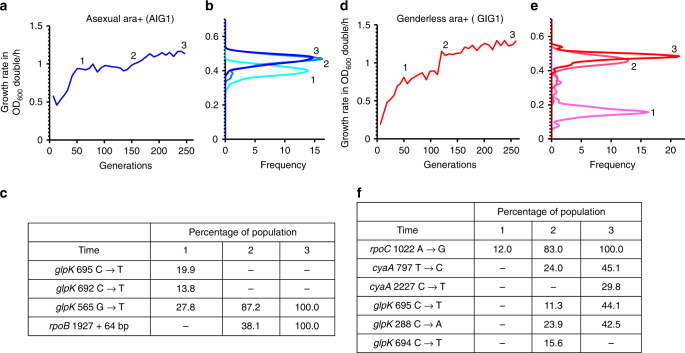
Fig. 3.
Correlating changes in population average fitness with dynamics of mutations in AIG1 and GIG1. a Population fitness data for population AIG1 (asexual ara+). b Population fitness distribution at Time = 1, 2, and 3 for AIG1. c Population-level sequencing data for observed mutations at Time = 1, 2, and 3 for AIG1. d Population fitness of GIG1 (genderless ara+). e Population fitness distribution at Time = 1, 2, and 3 for GIG1. f Population-level sequencing data for observed mutations at Time = 1, 2, and 3 for GIG1. See Supplementary Fig. 2 for correlation between population fitness and average isolate fitness

