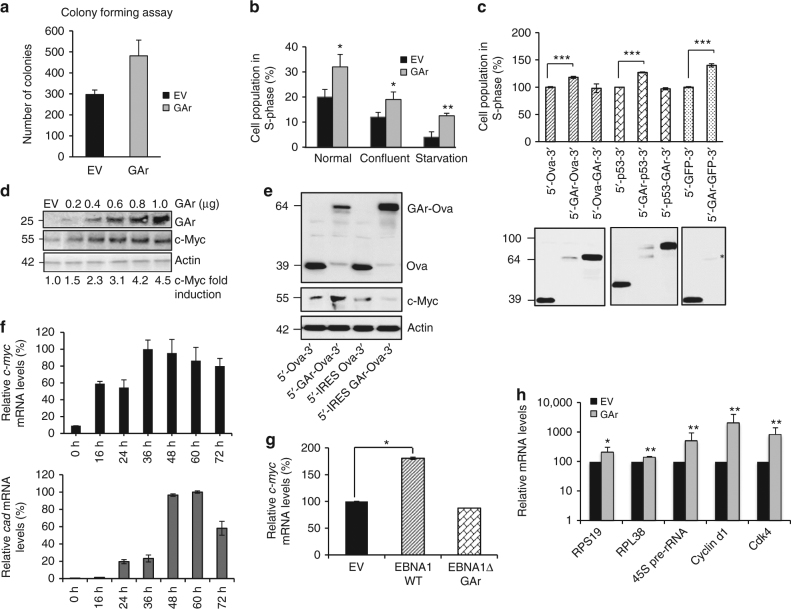
Fig. 1.
GAr-induced mRNA translation stress stimulates cell proliferation via c-Myc. a Colony forming assay. The number of colonies of H1299 cells expressing the gly-ala repeat (GAr) of the EBV-encoded EBNA1, or plasmid control (EV), were counted after 15 days in selection medium and plotted. b The graph shows the percentage of proliferating cells (S-phase) expressing the GAr or EV under indicated growth conditions as determined by FACS analysis. c Western blots (lower panel) show that fusing the GAr to the N terminus of the open reading frames of chicken ovalbumin (Ova), (GAr-Ova), p53 (GAr-p53) or GFP (GAr-GFP) suppresses mRNA translation, in contrast to when inserted at the C-terminal end (Ova-GAr or p53-GAr). The graph (upper panel) shows the relative number of cells in S-phase expressing the indicated constructs. d Western blots show the expression of c-Myc following expression of the indicated quantities of GAr cDNA in H1299 cells. The numbers below the blots indicate c-Myc levels normalised to actin. e Fusing the 5′ UTR of c-myc that contains IRES to the 5′ of GAr-Ova (IRES GAr-Ova) abrogates translation suppression and averts c-Myc induction. f The upper graph shows RT-qPCR of c-myc mRNA levels at indicated time points following expression of the GAr. The data show the relative c-myc/GAPDH mRNAs ratio and the highest value at 36 h is set to 100%. The lower graph shows the relative values of c-Myc-induced CAD mRNA levels relative to GAPDH. The highest value is set to 100%. g RT-qPCR analysis show the relative c-myc mRNA levels normalised to GAPDH in H1299 cells expressing EV, EBNA1 WT or EBNA1 ∆GAr. h RT-qPCR analysis of c-myc target genes (Cdk4, cyclin d1, 45S pre-rRNA, Rps19 and Rpl38) in cells expressing EV or GAr. Note the logarithmic scale. FACS analyses show mean values with s.d. from at least three independent experiments. Actin was used as a loading control. For western blots, RT-qPCR and colony formation assays representative of three independent experiments were shown with s.d. Statistical significance was calculated using t tests (***p < 0.001, **p < 0.05 and *p < 0.1)

