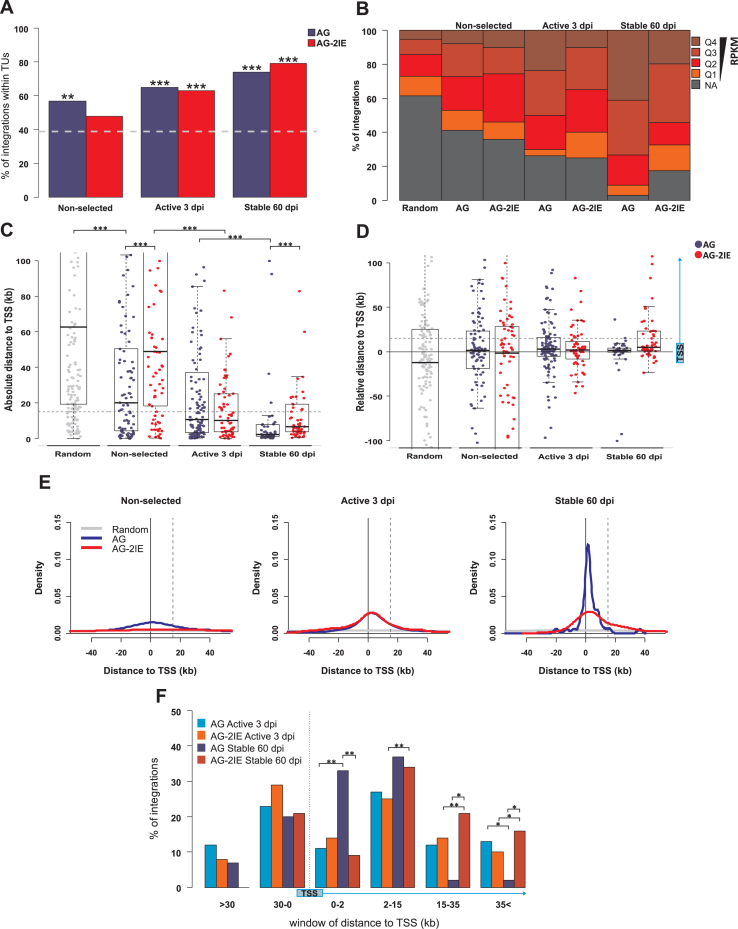
Figure 3.
Genomic features of integration sites of stably expressed proviruses. Four groups of integration sites were created representing the stages of selection for the expression stability presented in the paper: Random (200), Non-selected (90 AG, 82 AG-2IE), Active 3 dpi (124 AG, 63 AG-2IE) and Stable 60 dpi (46 AG, 58 AG-2IE). (A) The proportion of provirus integration into TUs represented by RefSeq Genes in the sets of AG proviruses and AG-2IE proviruses. The dashed line represents the percentage (39%) of TU targeting in the set of in silico generated random integration sites. (B) Frequency of proviruses integrated in TUs separated into categories by RPKM. Four quartiles of active TUs with Q4 being the most expressed group. NA represents the TUs with no detected or very low activity in the K562 cell line (RPKM < 1). (C) Absolute distance of proviruses to the closest transcriptional start site (TSS) of the TUs. Asterisks mark the P-value of Wilcoxon–Mann–Whitney Rank Sum Test. (D) Relative distance to TSS regarding the distribution of proviruses upstream and downstream to TSS. Positive values mark the distance to the nearest TSS of targeted TUs. Dashed line represents the distance of 15 kb inside TUs. (E) Density plots of the distance to TSS. Positive values mark the distance to TSS of proviruses inside TUs. Dashed line represents the distance of 15 kb inside TUs. (F) Barplots representing frequency of proviruses integrated within windows of distance to the TSS. Asterisks mark the P-value of Fisher's Exact Test for Count Data. *P < 0.05, **P < 0.01, ***P < 0.001.

