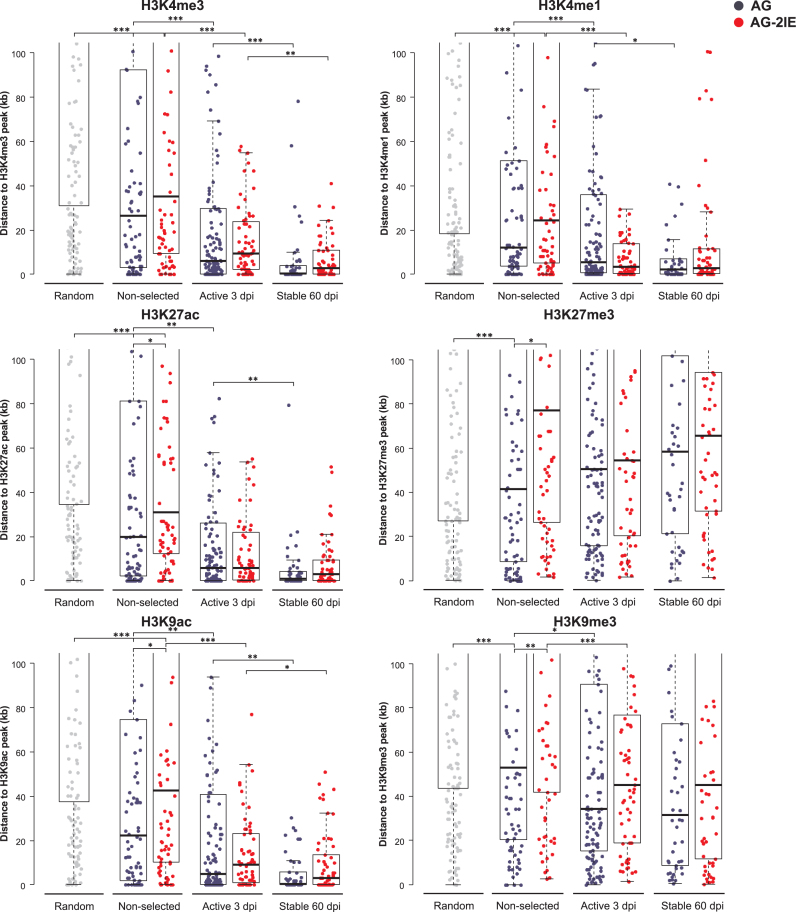
Figure 4.
Distance of proviruses to the peaks of histone modifications. Each dot represents a single provirus. The distance is measured as absolute distance to the nearest peak of a histone modification. More histone modifications evaluated in the study are depicted in Supplementary Figure S2. Asterisks mark the P-value of Wilcoxon–Mann-Whitney Rank Sum Test. *P < 0.05, **P < 0.01, ***P < 0.001.

