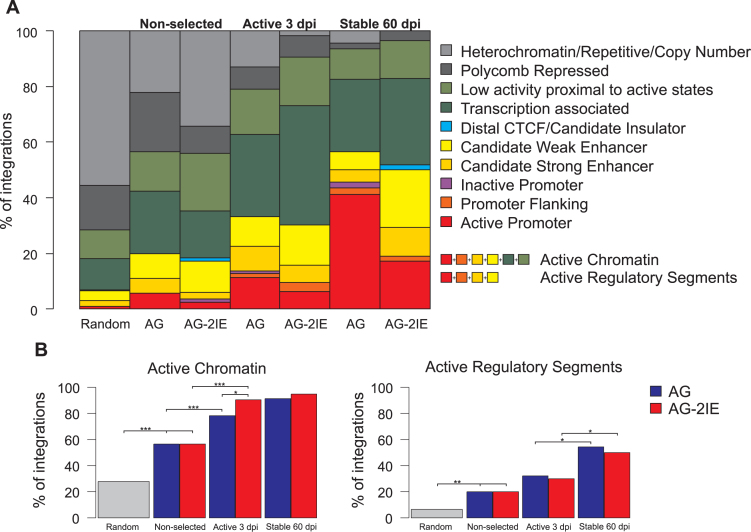
Figure 5.
Integration into ChromHMM functional chromatin segments. (A) Barplots represent the percentage of proviruses integrated in one of ten types of chromatin segments. (B) Frequencies of provirus integrations into the merged active chromatin segments or merged active regulatory elements. Asterisks mark the P-value of Fisher′s Exact Test for Count Data: *P < 0.05, **P < 0.01, ***P < 0.001.

