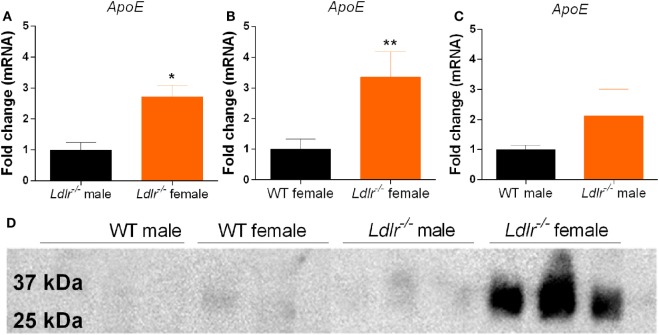
Figure 6.
Apolipoprotein E (ApoE) expression by peritoneal macrophages. Comparison of apoE gene expression between male and female ldlr−/− mice (MWU = 1; 6; 6; p < 0.0476) (n = 6) (A), wild-type (WT) and ldlr−/− female mice (MWU = 1; 6; 6; p < 0.0044) (n = 6) (B), and WT and ldlr−/− male mice (n = 6) (C). Western blot analysis of cell culture medium from LPS-stimulated peritoneal macrophages, stained for apoE (n = 3) (D).

