Fig. 2.
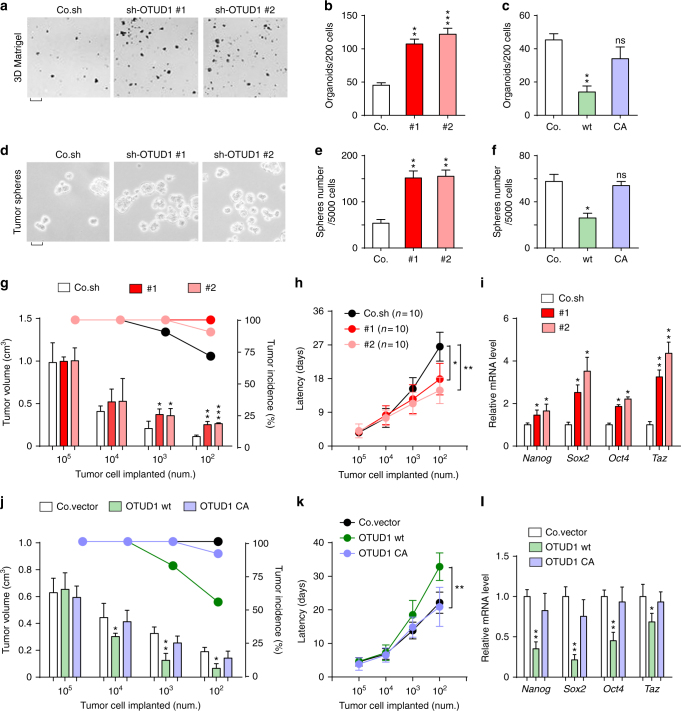
OTUD1 inhibits cancer stem cell traits. a, b Control and OTUD1-silenced MCF10A-RAS cells were cultured in 3D Matrigel. Representative wells a (scale bar, 2 mm) and mean number of organoids (±SE) per 200 cells from triplicate samples b. c Mean number of organoids (±SE) per 200 cells from triplicate samples of control and OTUD1-wt/CA overexpressed MCF10A-RAS cells cultured in 3D Matrigel. d, e Control and OTUD1-silenced MCF10A-RAS cells were analyzed in a tumor sphere assay. The pictures show representative images of tumor spheres (d, scale bar, 500 μm), and the graph shows the number of tumor spheres per 5 × 10³ cells seeded e. f Mean number of tumor spheres per 5 × 10³ cells from triplicate samples of control and OTUD1-wt/CA overexpressing MCF10A-RAS cells. g Control and OTUD1-shRNA silenced MCF10A-RAS cells were subcutaneous injected into nude mice at the indicated numbers. Mean of tumor volumes at week 5. h Tumor latency at indicated cell number of cells described in g. i Control and OTUD1-silenced MCF10A-RAS cells were subjected to qPCR analysis. j Control MCF10A-RAS cells or cells stably expressing OTUD1-wt or OTUD1-CA were subcutaneous injected into nude mice at the indicated numbers. Mean of tumor volumes at week 5. k Tumor latency at indicated cell number described in j. l Control MCF10A-RAS cells or cells stably expressing OTUD1-wt or OTUD1-CA were subjected to qPCR analysis. Error bars, mean ± SD. *p < 0.05, **p < 0.01, and *** p < 0.001 (two-tailed Student′s t-test b–l)

