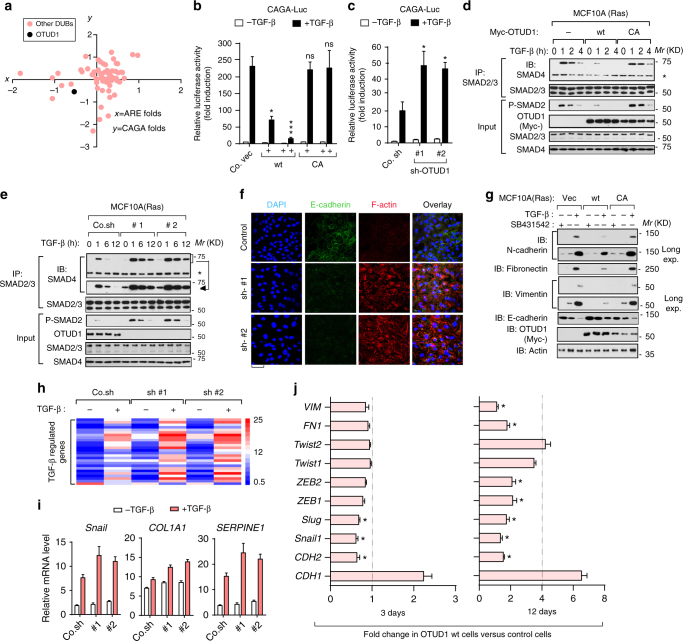
Fig. 3.
OTUD1 causes suppression of TGF-β downstream signals and EMT. a Diagram of DUB cDNA screen data in HEK293T cells in which DUBs that activate TGF-β-induced SMAD3/SMAD4-dependent CAGA12-Luc transcriptional reporter and TGF-β-induced SMAD2/SMAD4-dependent ARE-Luc are indicated. The x-axe is the ARE-luciferase activity and y-axe is the CAGA-luciferase activity, shown as Log_2 value of ligand-induced fold changes. b, c Effect of ectopic OTUD1 wild-type (OTUD1-wt) and OTUD1-CA mutant (b) or OTUD1knockdown (sh-OTUD1 #1 and #2) (c) on CAGA12-Luc transcriptional response induced by TGF-β in HEK293T cells. Co.vec, empty vector; Co.sh, non-targeting shRNA. d, e IB of total cell lysate and anti-SMAD2/3 immunoprecipitates derived from control and MCF10A-RAS cells stably depleted for OTUD1 (d) or stably expressing Myc-OTUD1-wt/C320A (e) and treated with TGF-β (5 ng/ml) as indicated. SMAD2/3-associated SMAD4 was analyzed by IB. 5% total cell lysate was loaded as input and were analyzed for P-SMAD2, OTUD1, SMAD2/3, and SMAD4. f Immunofluorescence and 4, 6-diamidino-2-phenylindole (DAPI) staining of control and HaCaT cells stably depleted of OTUD1 and treated with TGF-β (2.5 ng/ml) for 72 h. Scale bar, 50 μm. g IB of cell lysates derived from MCF10A(RAS) cells stably expressed with control empty vector (Vec), or OTUD1-wt/CA constructs and treated with TGF-β (2.5 ng/ml) and SB431542 (10 μM) for 72 h. h Heat map of TGF-β regulated genes in control cells (Co.sh) or MCF10A (RAS) cells stably depleted for OTUD1 with two independent shRNA (#1 and #2) and treated with or without TGF-β (2.5 ng/ml) for 8 h. i qRT-PCR analysis of TGF-β target genes Snail, COL1A1, and SERPINE1 in control and OTUD1 stably depleted MCF10A (RAS) cells treated with TGF-β (2.5 ng/ml) for 8 h. Values and error bars represent the means ± SD of triplicates and are representative of at least two independent experiments. j qRT-PCR analysis of MDA-MB-231 (BM) cells infected with control of OTUD1-wt-expressing virus for 3 days (left panel) or 12 days (right panel). *p < 0.05, **p < 0.01 and ***p < 0.001 (two-tailed Student′s t-test b–j)

